
Software Was 69% of Tech Hiring. Data and AI Took the Rest.
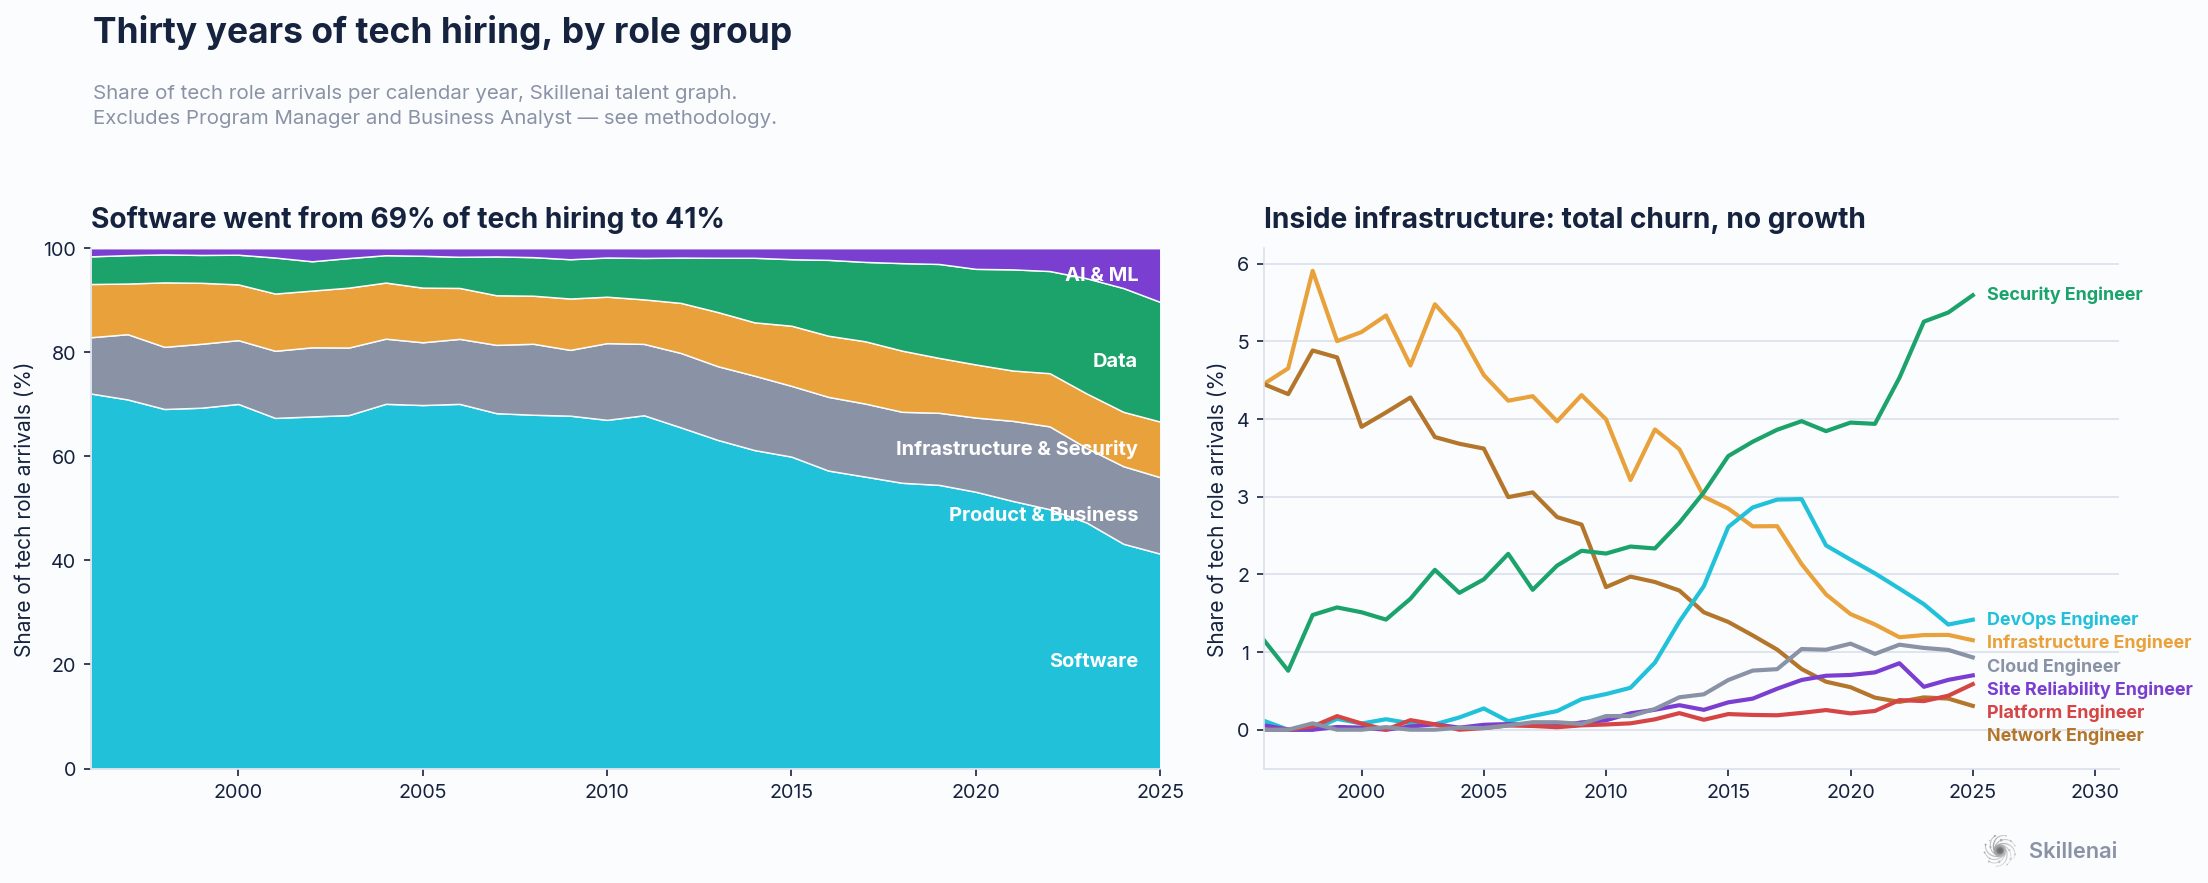
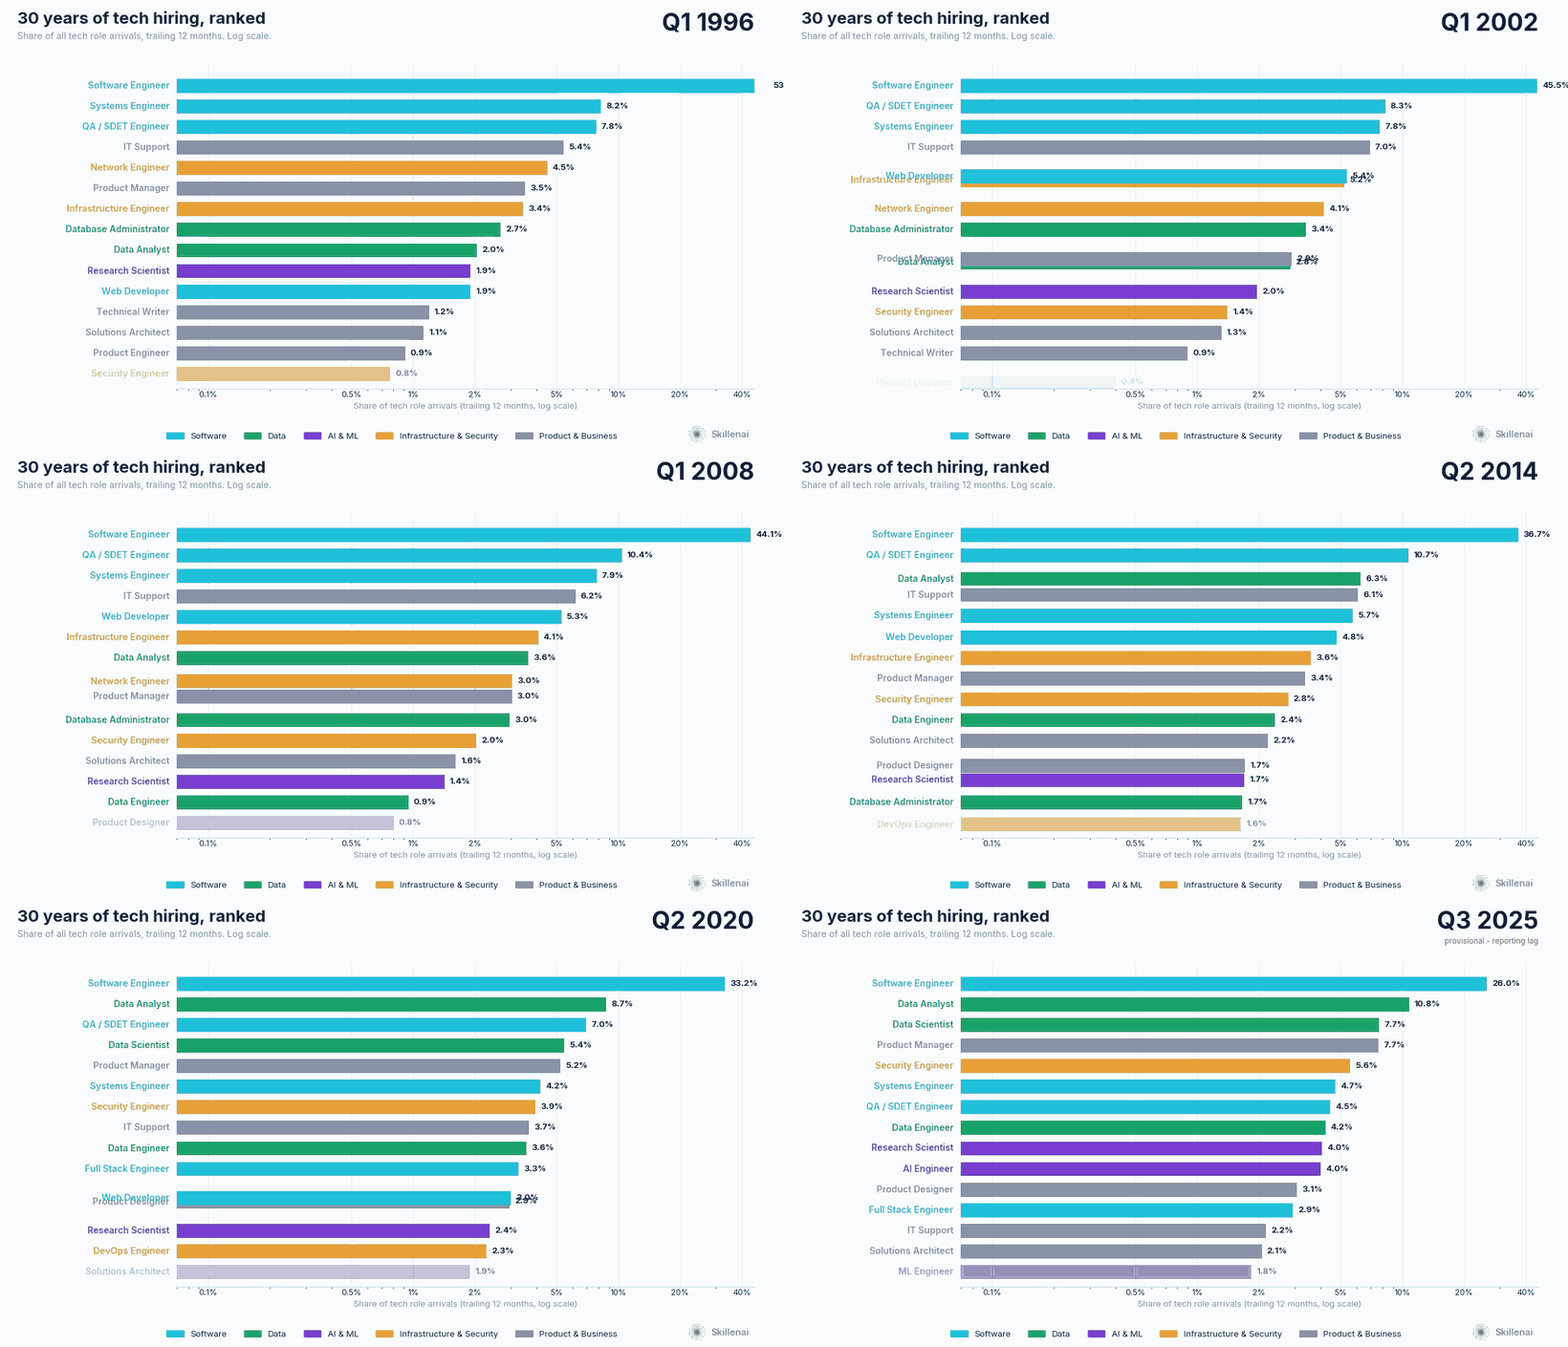
Software Engineering used to be most of tech hiring. In 1998 it was 69% of every tech role anyone started. In 2025 it is 41%.
That share didn't evaporate. It moved — and not to where most people assume. We traced 568,663 career histories from the Skillenai talent graph back to the mid-1990s to find out where it went.
Get an email when we publish a new post. No account needed, unsubscribe anytime.
Data took more than AI did
| Group | 1998 | 2010 | 2018 | 2025 |
|---|---|---|---|---|
| Software | 69.1% | 67.0% | 54.9% | 41.3% |
| Data | 5.4% | 7.5% | 16.8% | 23.0% |
| AI & ML | 1.2% | 1.8% | 2.9% | 10.3% |
| Infrastructure & Security | 12.4% | 8.9% | 11.8% | 10.7% |
| Product & Business | 11.9% | 14.7% | 13.6% | 14.7% |
Data and AI went from 6.6% of tech hiring to 33.3% between them. Software fell by almost exactly that amount.
The AI share is the one everyone talks about, and it is real — a near ten-fold rise. But data roles are more than twice as large, and they started growing a decade earlier.
The cloud era was a substitution, not an expansion
Infrastructure looks flat — a 9-12% band for thirty years. That flatness hides a complete replacement of its contents.
| Role | 1998 | 2010 | 2018 | 2025 |
|---|---|---|---|---|
| Infrastructure / sysadmin | 5.9% | 4.0% | 2.1% | 1.2% |
| Network Engineer | 4.9% | 1.8% | 0.8% | 0.3% |
| Security Engineer | 1.5% | 2.3% | 4.0% | 5.6% |
| DevOps Engineer | 0.0% | 0.5% | 3.0% | 1.4% |
Sysadmins and network engineers were swapped for security, DevOps and cloud roles. The group never grew. This matters for how you read the AI numbers: AI and data are expanding the pie, cloud redistributed it.
DevOps is its own warning. It peaked at 3.0% of tech hiring in 2018 and is down 52% since, as platform, SRE and cloud titles absorbed the work. A role can win its argument and still lose its title.
"AI and data" is not one job market
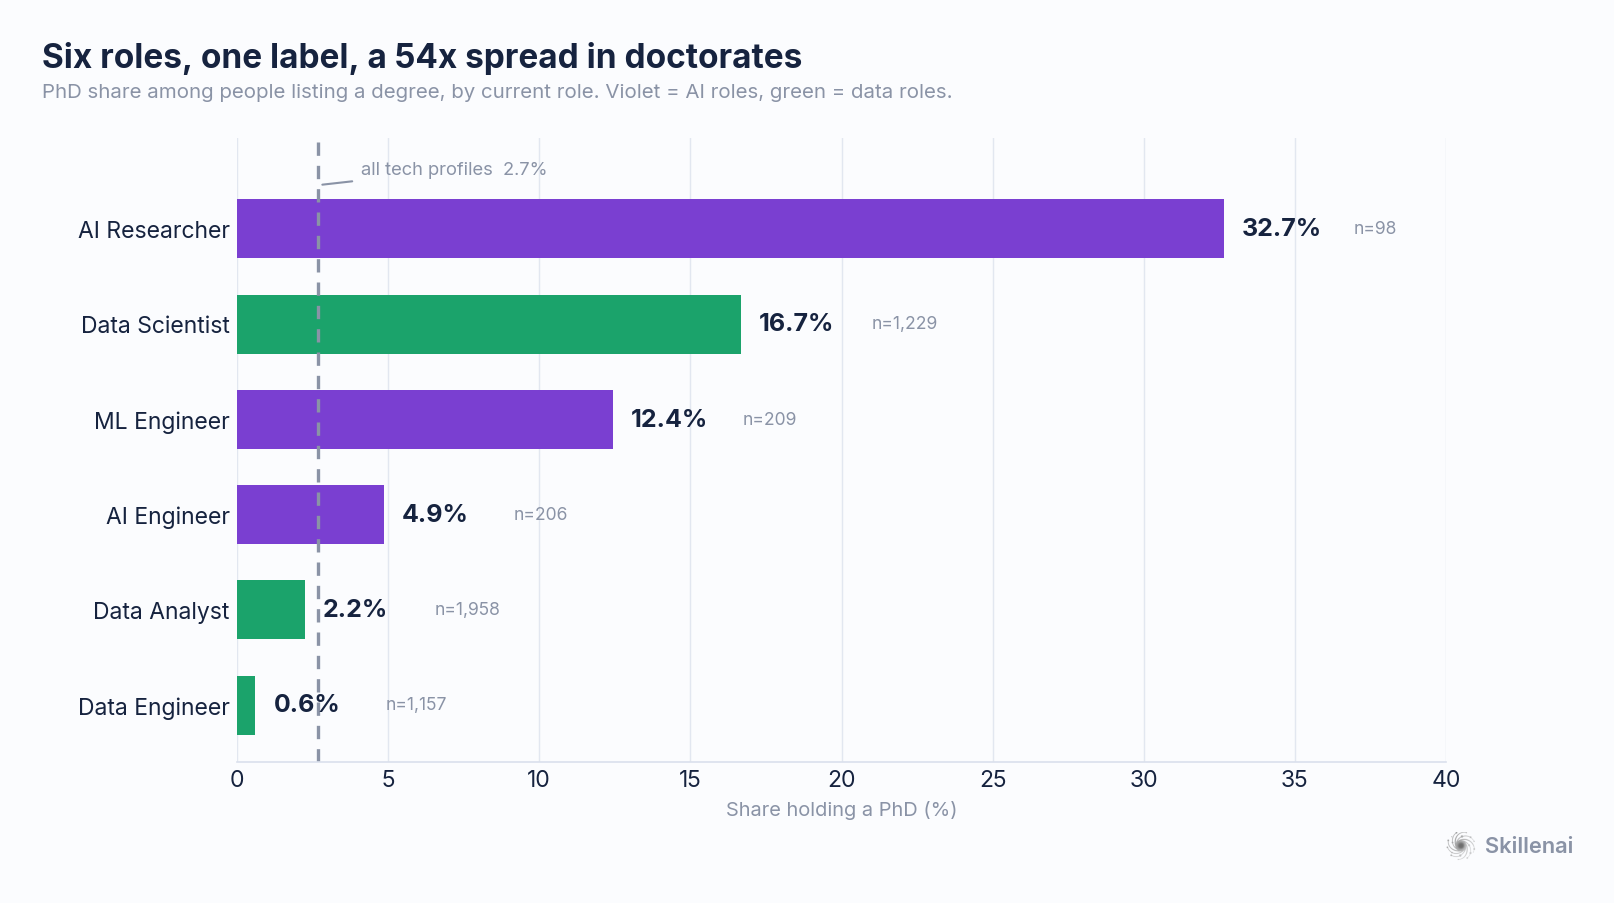
Here is where it gets uncomfortable. Six roles routinely discussed as one talent pool, ranked by how many of their people hold a doctorate:
| Role | PhD share | Share of tech hiring, 2025 |
|---|---|---|
| AI Researcher | 32.7% | 4.0% |
| Data Scientist | 16.7% | 7.9% |
| ML Engineer | 12.4% | 1.8% |
| AI Engineer | 4.9% | 4.0% |
| Data Analyst | 2.2% | 11.2% |
| Data Engineer | 0.6% | 4.2% |
| All tech profiles | 2.7% | — |
That is a 54x spread between the top and the bottom. An AI Researcher is eleven times more likely to hold a doctorate than a Data Analyst.
And the two largest roles on that list — Data Analyst and Data Engineer — sit at or below the tech-wide baseline of 2.7%.
Who actually came from academia
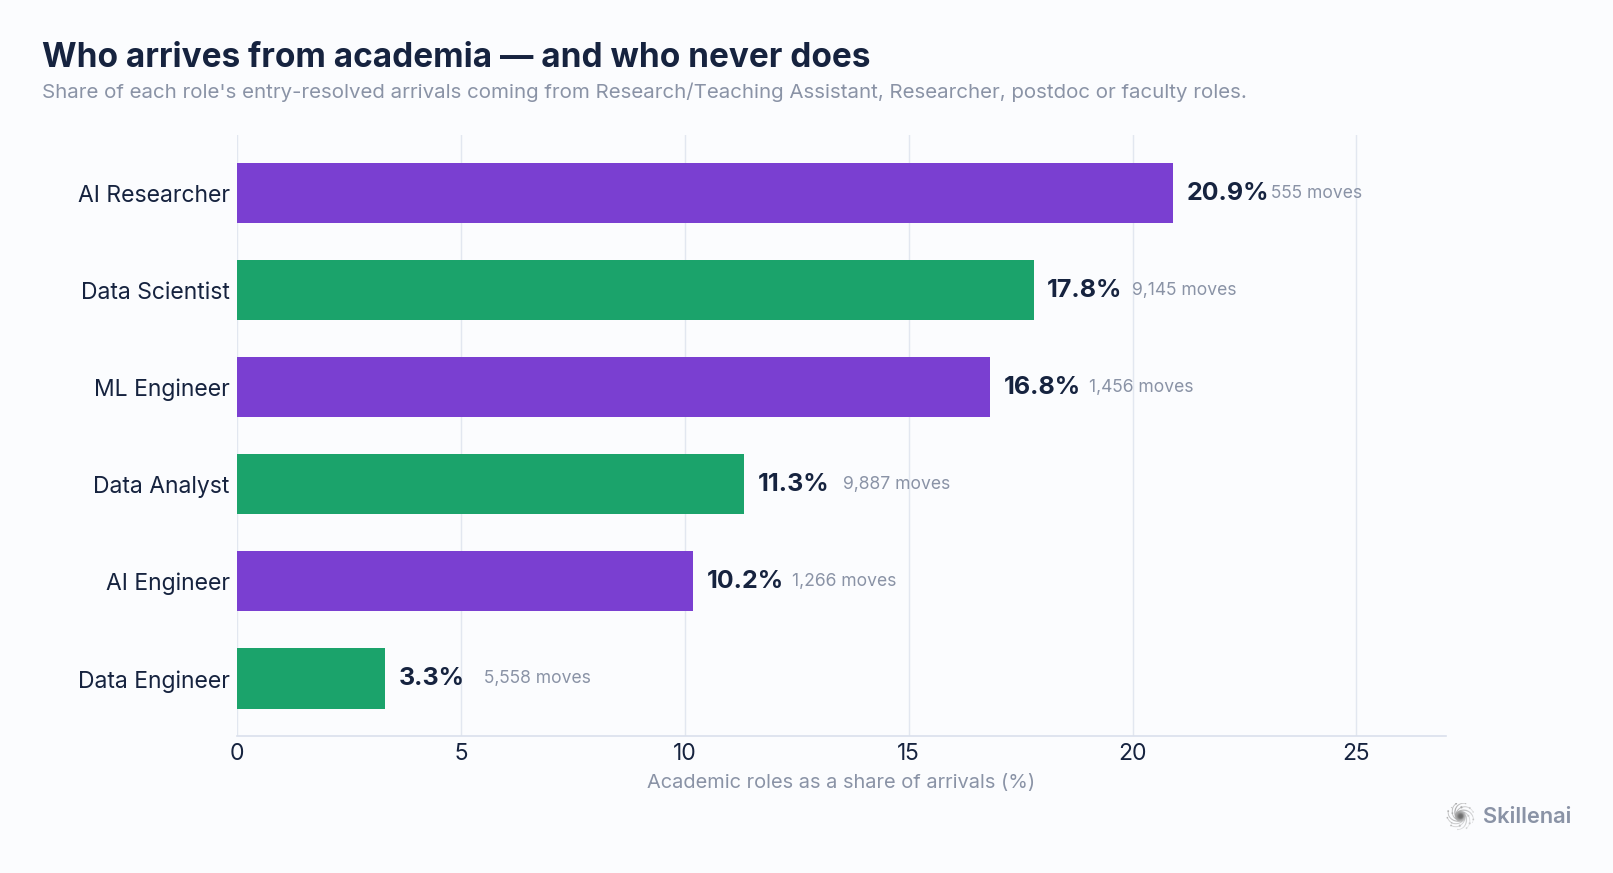
The credential gap shows up again in career histories, measured a completely different way: the role each person held immediately before they arrived.
| Role | Arrivals from academic posts |
|---|---|
| AI Researcher | 20.9% |
| Data Scientist | 17.8% |
| ML Engineer | 16.8% |
| Data Analyst | 11.3% |
| AI Engineer | 10.2% |
| Data Engineer | 3.3% |
Two independent measures, same ordering. The gaps against AI Engineer are significant at p < 1e-6.
Data Engineering is the clearest case. It takes 3.3% of its people from academia and 29% straight from Software Engineer. By both measures it is a software job that happens to touch data.
So the common story — that the AI boom drained the universities — is only half right. Academia fed Data Science and AI Research. What fed AI Engineering and Data Engineering was software.
The intake never diversified
AI Engineer arrivals grew roughly 8x between 2020 and 2024. Over the same stretch, the mix of roles those people came from did not measurably change (chi-square: p = 0.63; no top-five feeder moved more than 9.6 points).
The field scaled tenfold without changing who it recruits.
What this means for your career
If you're a software engineer: the roles that absorbed your field's share are largely reachable without going back to school. Data Engineering takes more of its people from Software Engineer than from anywhere else, and almost none from academia.
If you have a doctorate: the credentialed end of this market is real but small. AI Researcher is 4.0% of tech hiring. Data Analyst is 11.2%.
If you're hiring: treating "AI/data" as one pipeline will mis-target every one of these roles. They differ by 54x on doctorates and 6x on academic intake.
If you're early in your career: the largest single destination in this whole space is Data Analyst, and it needs no PhD at all.
One thing the data does not say
It is tempting to read the table above as "the fastest-growing roles are the least credentialed." We tested that directly and it does not hold: across the six roles, growth and PhD rate correlate at r = -0.25, p = 0.63. Data Analyst is large and uncredentialed; Data Scientist is large and credentialed. The spread is the finding, not a slope.
Methodology
568,663 unique career histories from two independent Skillenai talent-graph snapshots (94.8% disjoint, deduplicated on profile id). Role transitions are entity-resolved, so a move is Software Engineer to AI Engineer rather than a keyword guess.
Figures report share of tech hiring, not headcount, deliberately. Recorded role starts in this corpus rise from 3,294 in 1990 to 112,143 in 2024, and almost all of that ramp is LinkedIn adoption and retrospective self-reporting rather than hiring growth. Racing raw counts would show every role rising at once, including dying ones.
Employment records are current to about October 2025. After adjusting for calendar seasonality — January carries 11.9% of annual role starts against December's 4.8% — coverage holds through July 2025 and then falls off, so later windows are marked provisional. The final period of any series here should not be read as a decline.
PhD share is computed among people who listed any degree, which overstates the level (doctorate holders are likelier to record the credential) but preserves the ordering — which is what the comparison rests on, and which the independent academic-intake measure corroborates.
Program Manager and Business Analyst are excluded from both the charts and the denominator. Both enter the corpus through an ingest keyword list rather than because they are tech roles: 90% of "Program Manager" titles carry no technical qualifier and roughly one in ten sit at defense primes, while "Business Analyst" is led by a strategy consultancy that uses it as an entry-level consultant title, followed by three health insurers.
Full methodology, figures, and the analysis code are on GitHub, including a higher-quality version of the leaderboard video.