
How Big Should a Data Team Be? 547,000 Profiles Say 1 in 9
Get an email when we publish a new post. No account needed, unsubscribe anytime.
Stop measuring against total headcount
The instinct is to compute data headcount as a share of total company employees. That number is nearly meaningless, because it mostly measures what industry you're in. A 3,000-person health insurer and a 3,000-person SaaS company have completely different fractions of staff in any technical role, so the comparison never lands.
Measure against the tech org instead — everyone in software, product, data, AI and design — and the noise disappears.
Finding 1: a data team is about 1 in 9 of the tech org
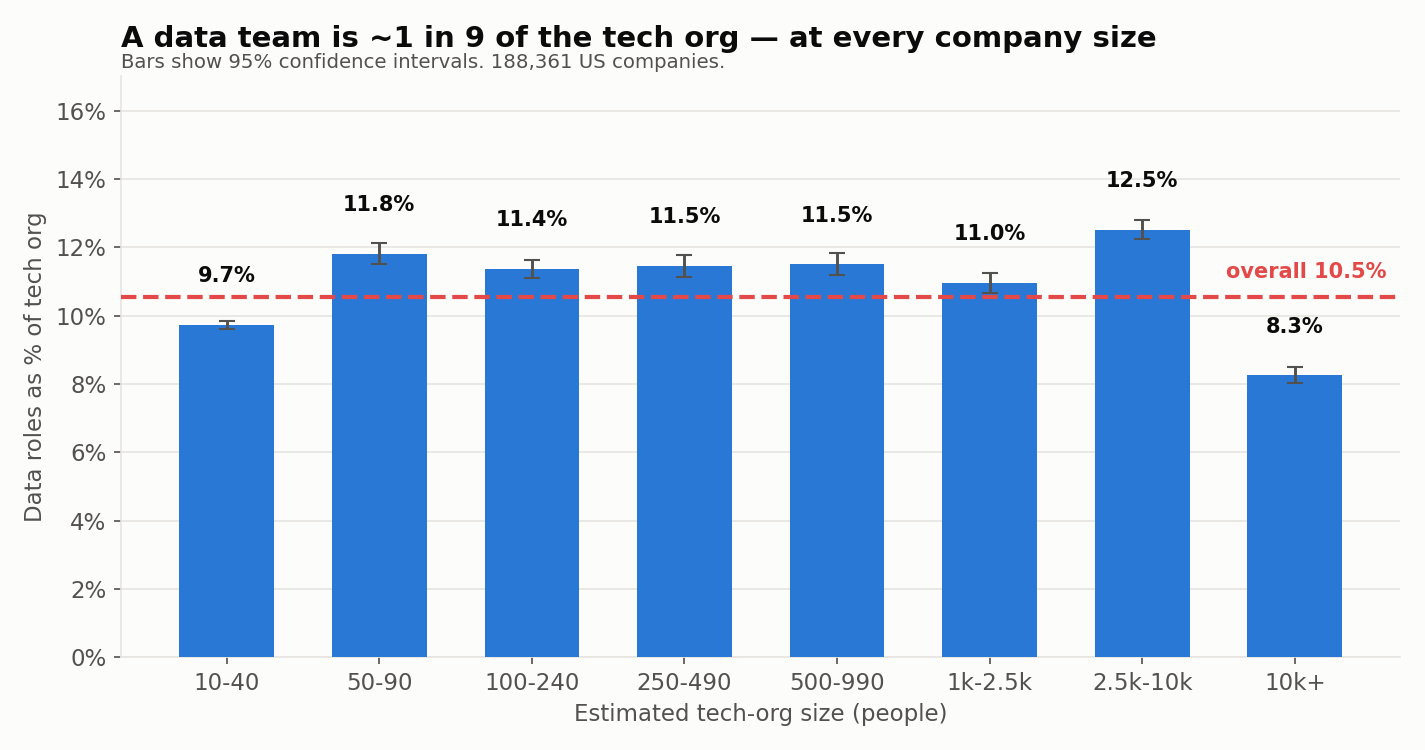
Across 188,361 companies, data roles are 10.5% of the tech org. Split into eight size bands spanning roughly 10-person tech teams to 10,000+, every single band lands between 9.7% and 12.5%.
| Est. tech org | Companies | Data share | 95% CI |
|---|---|---|---|
| 10-40 | 176,036 | 9.7% | 9.6-9.9% |
| 50-90 | 6,583 | 11.8% | 11.5-12.1% |
| 100-240 | 3,613 | 11.4% | 11.1-11.6% |
| 250-490 | 1,130 | 11.5% | 11.1-11.8% |
| 500-990 | 539 | 11.5% | 11.2-11.8% |
| 1k-2.5k | 308 | 11.0% | 10.7-11.2% |
| 2.5k-10k | 126 | 12.5% | 12.2-12.8% |
| 10k+ | 26 | 8.3% | 8.0-8.5% |
A hundred-fold change in company size moves the ratio by about two points. If you want one number to benchmark against, one data person per nine in the tech org is it.
The dip at the small end is companies with one or two technical people who haven't made a dedicated data hire yet. The dip at the top is a handful of very large employers whose tech orgs carry enormous platform and infrastructure populations that dilute the data function.
Finding 2: the size is fixed, the shape is not
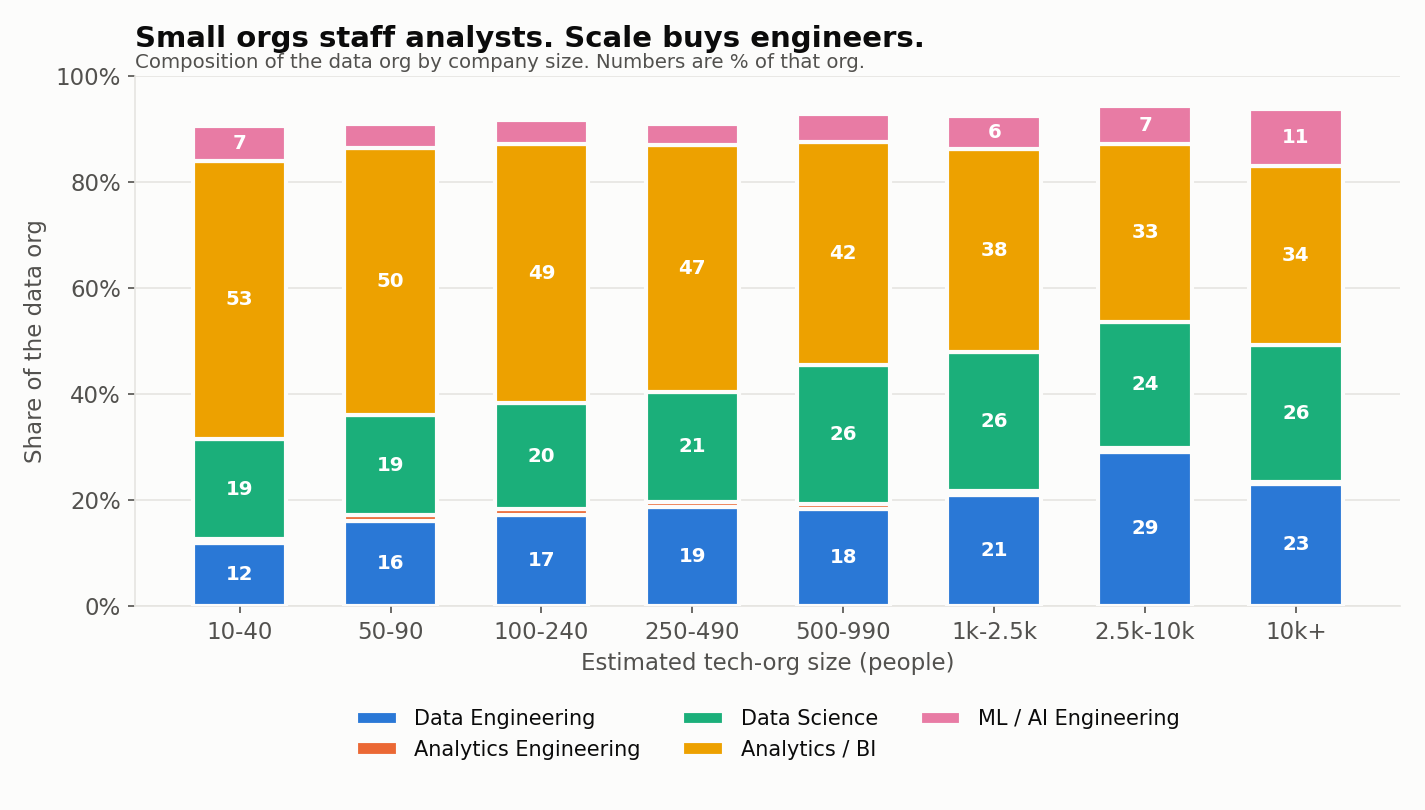
Here is where the real variation lives. As the tech org grows:
- Data Engineering more than doubles — 11.9% to 29.1% of the data org
- Analytics / BI falls by a third — 52.5% to 33.5%
- Data Science climbs — 19.0% to 25.7%
- ML / AI Engineering more than doubles — 4.6% to 10.8%
At small scale, a data team is mostly people who answer questions. At large scale, it is mostly people who build the systems that answer questions. The transition is gradual and monotonic — there is no magic headcount where a company suddenly needs data engineers.
The practical reading: if you run a 200-person tech org whose data team is half analysts, you look exactly like your peers. If you run a 3,000-person tech org with that same shape, you are carrying an analyst-heavy structure into a scale where most companies have converted to engineering — and your ticket queue is probably already telling you so.
Finding 3: hiring is AI-shaped, the workforce is still analyst-shaped
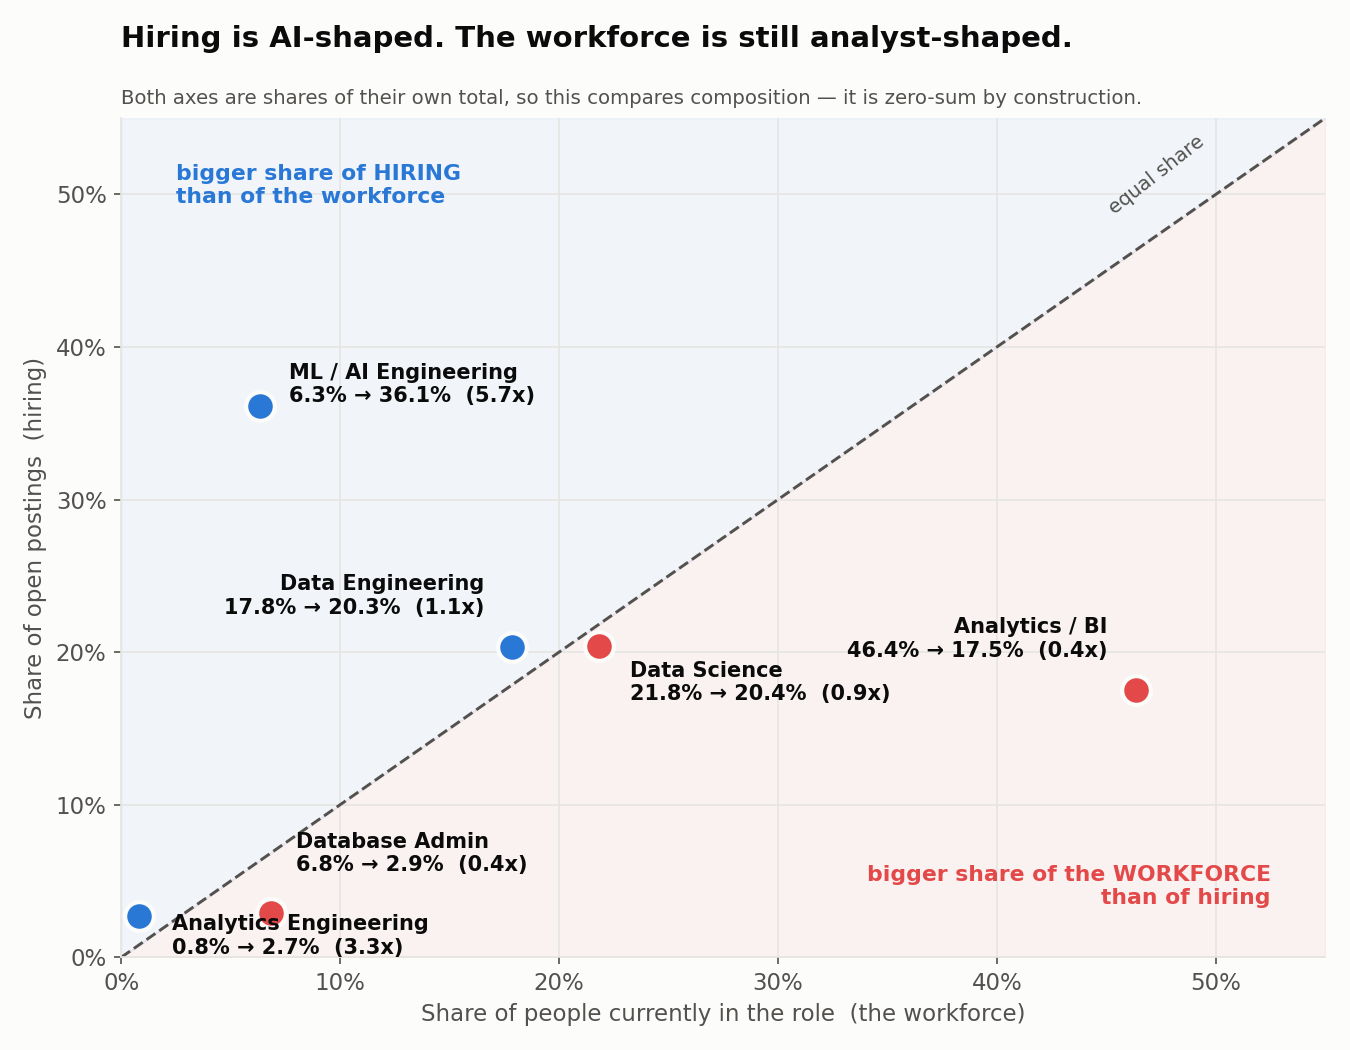
Put the workforce (what people currently do) against open postings (what employers are trying to hire) and every role lands on the same axes.
| Role | Share of people | Share of postings | Hiring / workforce |
|---|---|---|---|
| ML / AI Engineering | 6.3% | 36.1% | 5.7x |
| Analytics Engineering | 0.8% | 2.7% | 3.3x |
| Data Engineering | 17.8% | 20.3% | 1.1x |
| Data Science | 21.8% | 20.4% | 0.9x |
| Database Admin | 6.8% | 2.9% | 0.4x |
| Analytics / BI | 46.4% | 17.5% | 0.4x |
Read this as a comparison of two mixes, not as a shortage. Both columns are shares of their own total, so the diagonal is zero-sum by construction — if one role is over-represented in hiring, another has to be under-represented. The finding is that the shape of what employers are buying is very different from the shape of who is available.
ML / AI Engineering is the extreme case: 6.3% of people in data roles, but 36.1% of open data postings. Analytics Engineering is second at 3.3x, and is the smallest of the six in absolute terms — fewer than 1 in 100 people in a data role hold the title.
Data Engineering and Data Science sit close to parity (1.1x and 0.9x). For those two, the workforce and the hiring market are roughly the same shape.
On the other side are Analytics / BI and Database Admin, both at 0.4x. BI is the one that matters, because of its size: 46% of the data workforce, 18% of the hiring.
That row is the counterweight to everything above it. Nearly half the people in data roles today sit in the category employers are hiring into least, relative to its size.
And it is the same pattern as Finding 2, seen from a different angle. Small orgs are BI-heavy, large orgs are engineer-heavy — and the hiring market as a whole is pointed at the large-org shape. The market is hiring toward the shape big organizations already have.
This does not mean analyst roles are disappearing. 17.5% of a large hiring market is a great many jobs, and the BI function is not going anywhere. But if you are reading this as a career signal, the two categories growing fastest relative to their size are both the ones that sit between analysis and engineering.
What to do with this
If you're sizing a team: benchmark against your tech org, not your company. Land near 10% and you're normal. Then ask the harder question — is your mix right for your scale?
If you're defending a lean team: the ratio is your argument. A data function at 8% of a 500-person tech org is genuinely lean, and now you can say so with a distribution behind you rather than a feeling.
If you're planning your own career: the two roles hired furthest above their share of the workforce — ML/AI Engineering and Analytics Engineering — both sit between analysis and engineering. That is where the gap is widest.
Methodology
Supply side. 568,663 unique US profiles from a licensed LinkedIn dataset, assembled from two monthly snapshots and deduplicated on profile ID; 546,984 carry a current employer and usable current title. Each profile contributes one row: current employer plus best-available current title, taken from structured experience where present and parsed from the headline otherwise.
Demand side. 181,955 US job postings from the Skillenai jobs index, aggregated by normalized role. The same classifier runs over both sides, so supply and demand are directly comparable.
Business Analysts are excluded — all 13,398 of them, the largest single title in the corpus. They are predominantly IT requirements roles rather than data practitioners, and companies employing both treat them as different jobs. Including them would move the headline from 10.5% to 15.8%.
Finding 3 compares two mixes, not two levels. Both axes are shares of their own total, so the comparison is zero-sum — a role above the diagonal mathematically requires another below it. It says the hiring mix differs from the workforce mix; it does not establish an absolute shortage of any role. It also compares a stock (everyone currently in a role) to a flow (openings advertised in a window), so roles with faster turnover or growth generate more postings per person employed.
These are ratios, not headcounts. The corpus only sees people whose LinkedIn headline carries a recognizable job title, and plenty of people write a tagline instead. That recall gap is roughly uniform across roles, so proportions hold up, but any absolute headcount from this data is a floor rather than an estimate. Results are pooled across companies rather than averaged per company — at this sampling density an individual mid-size company's data team is Poisson noise, and only a population of them is measurable.
Validation. The corpus reproduces BLS Occupational Employment Statistics (2025) cross-role ratios: Data Scientists to Database Administrators is 3.19 here versus 3.75 at BLS. Proportions carry 95% Wilson score intervals.