
23 PRs a Week, Solo: Agent Orchestration Without the Coordination Tax
Get an email when we publish a new post. No account needed, unsubscribe anytime.
Where I actually land
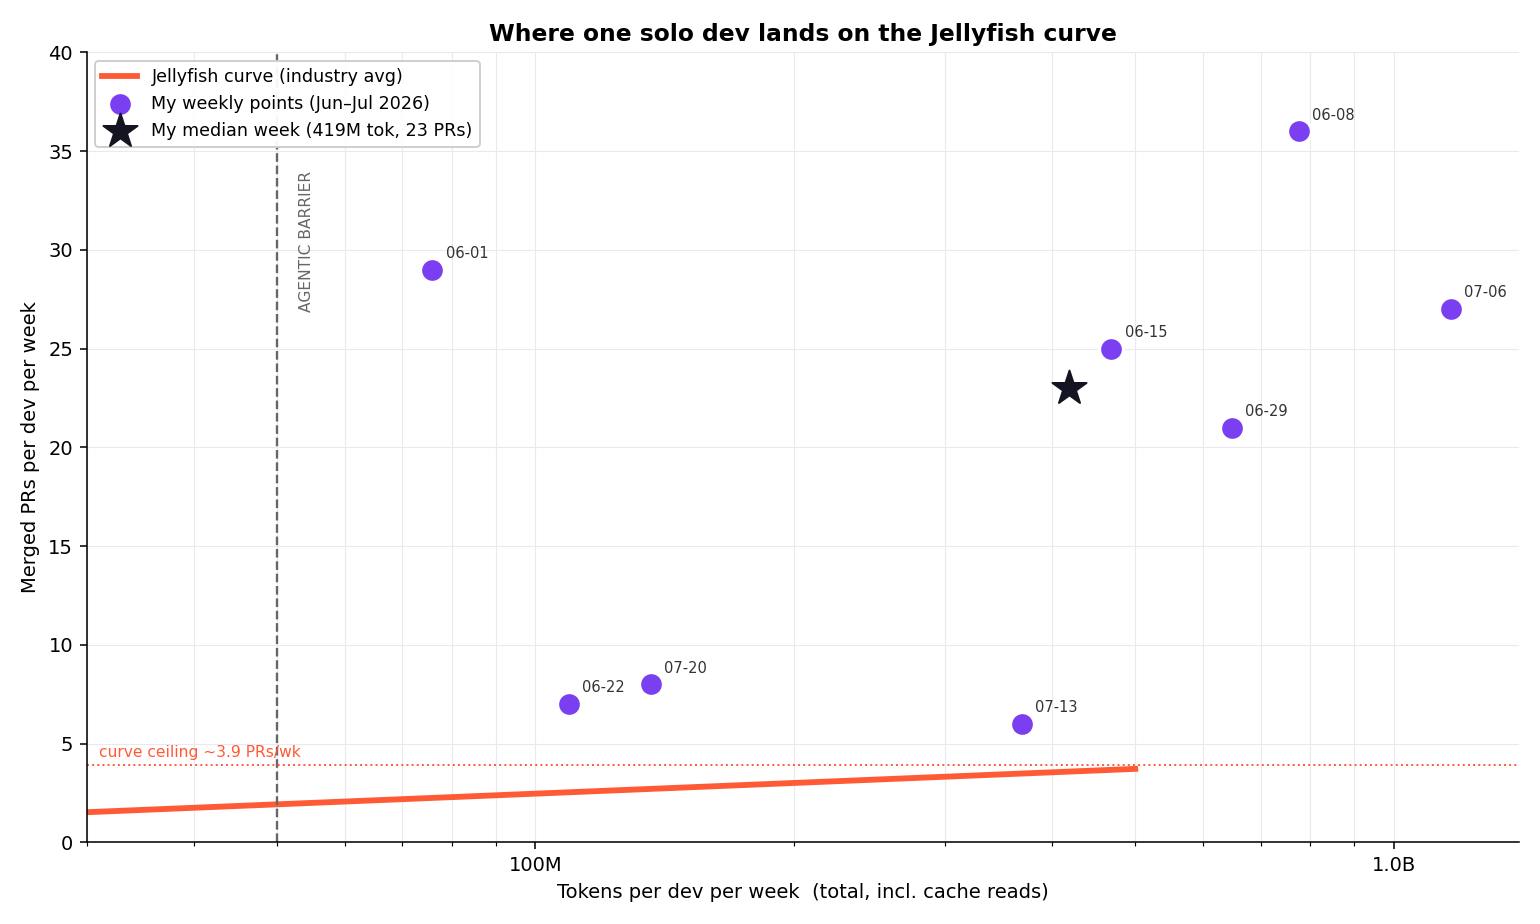
Over the eight weeks I have clean token logs for (June–July 2026), here's the comparison:
| Metric | Jellyfish population | Me (solo + agents) |
|---|---|---|
| Median tokens / week | chart tops out at 500M | 419M |
| Peak tokens / week | 500M (right edge) | 1.17B — 2.3× off the chart |
| Median merged PRs / week | curve ceiling \~3.9 | 23 |
| Best week | — | 36 |
My median week sits about 6.4× above the curve's PR ceiling. My busiest token week runs clean off the right edge of their plot. Even my two laziest weeks — 6 and 8 PRs — clear the top of their chart.
This isn't one heroic week
It's the steady state. Most weeks land 20–36 merged PRs and 5–16 completed tickets, spread across six repositories — a Fargate backend, a data pipeline, a public API and plugin set, and a notebooks repo. In a company, that surface area is three or four teams with three or four standups.
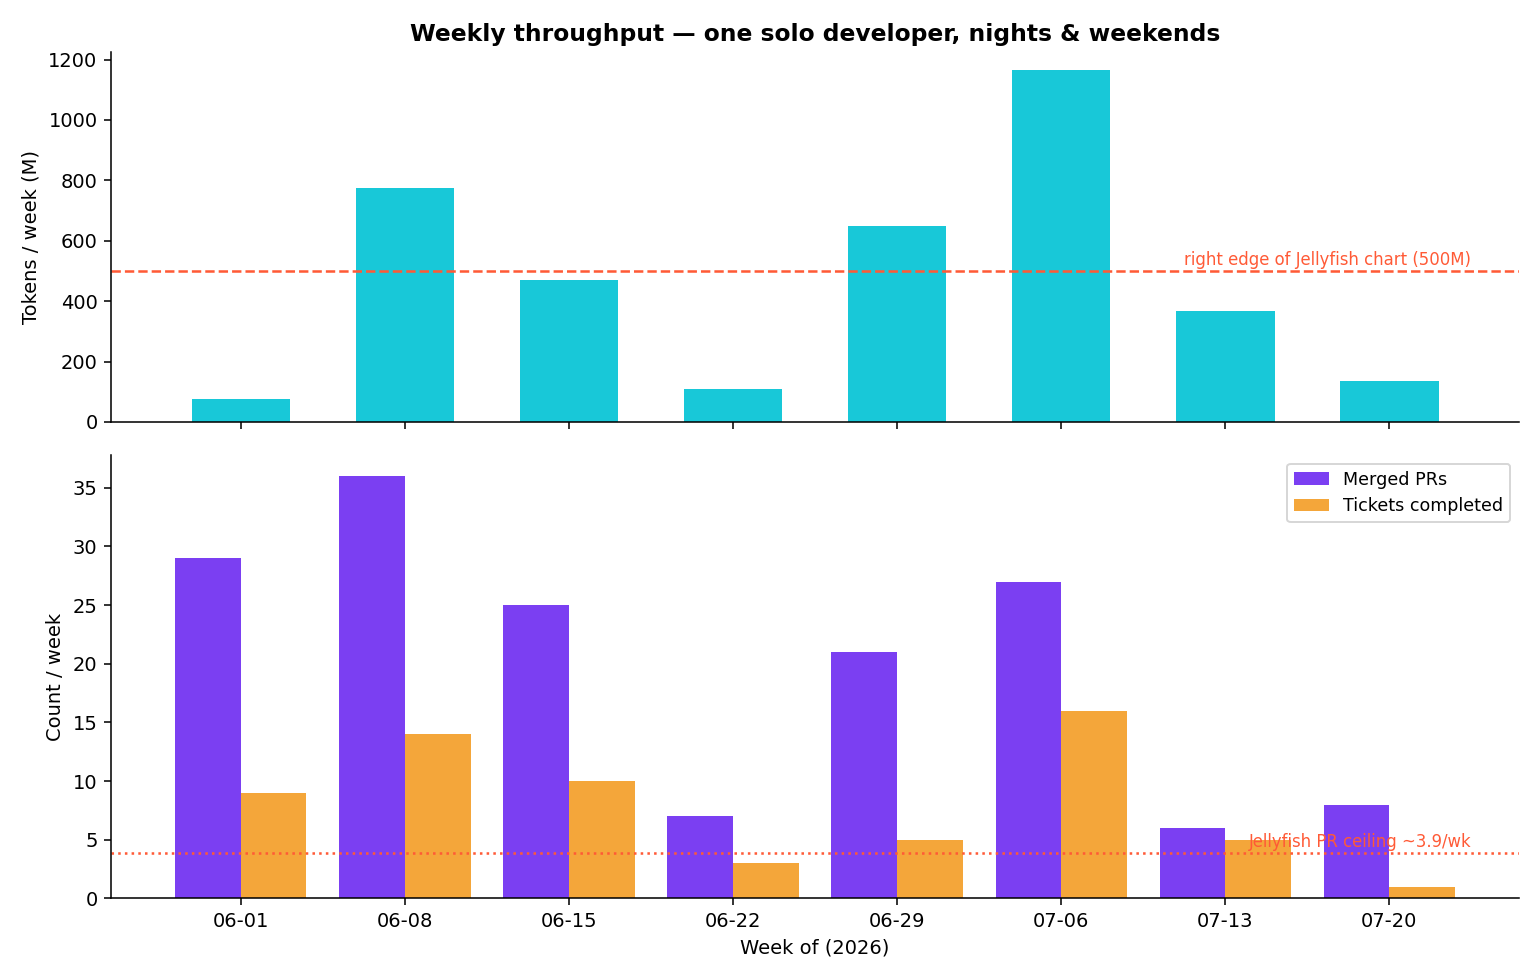
Across the full window it's 573 merged PRs. And the tickets — a separate, coarser tracker of units of work finished — move right alongside the PR count. That matters, because it means the number isn't an artifact of chopping work into tiny PRs to game a metric. Real things got finished.
So why does a solo dev clear the plateau?
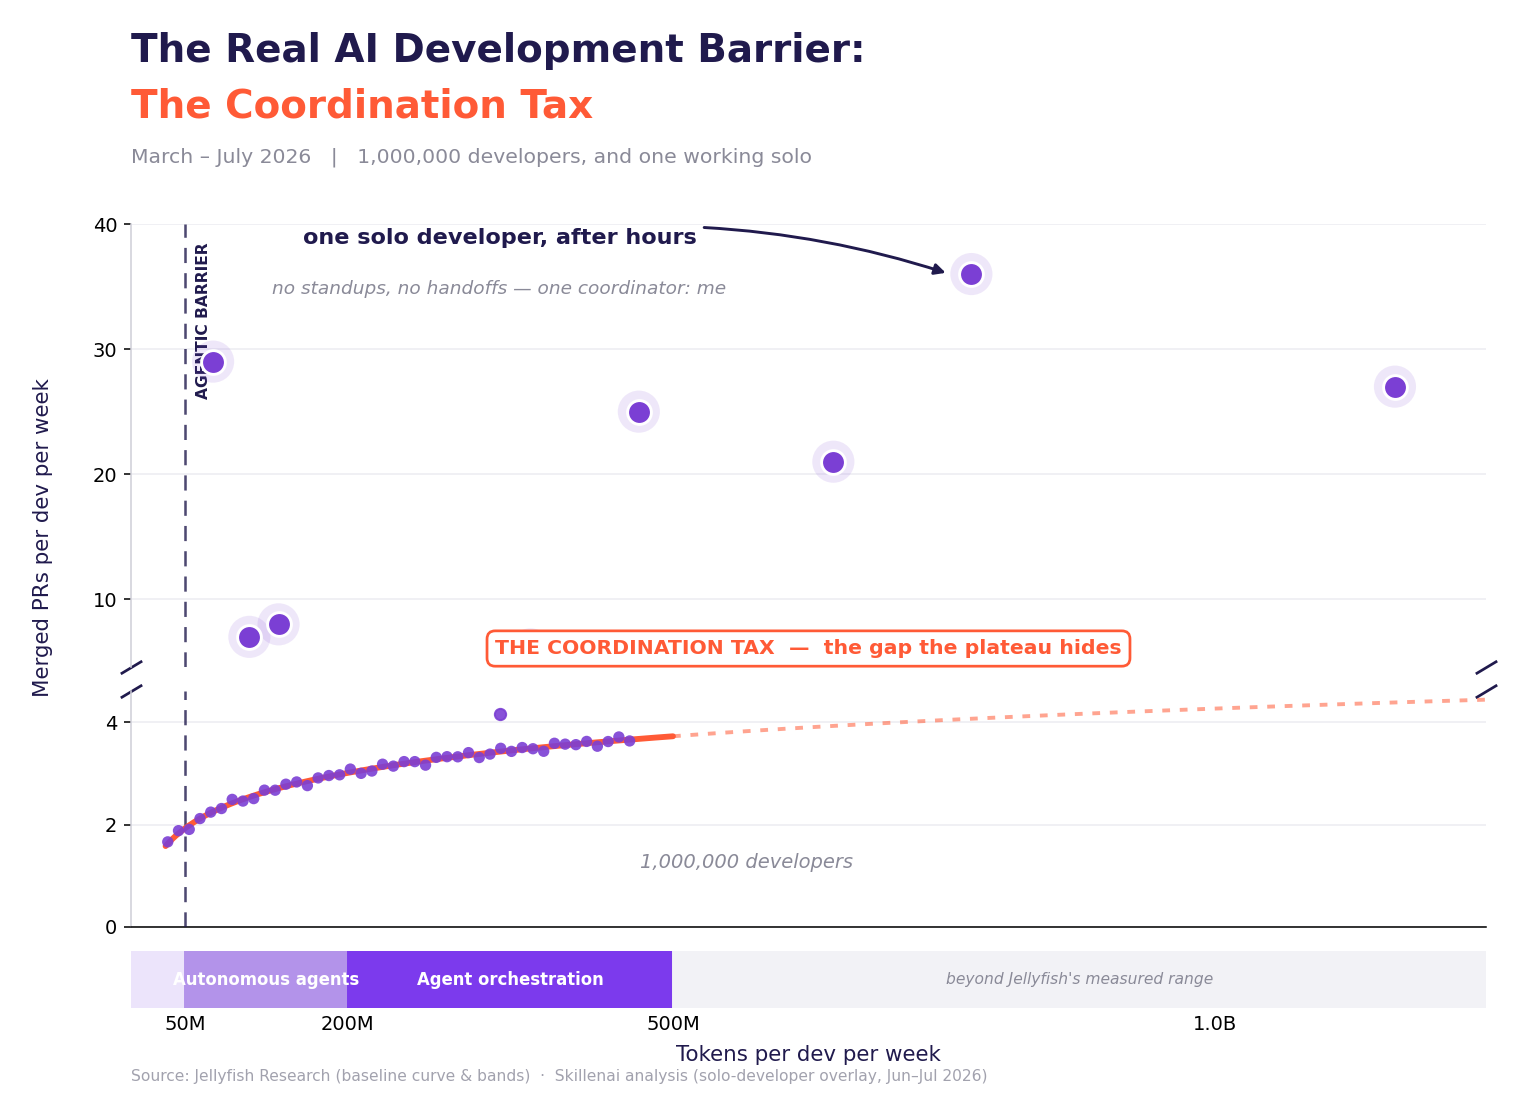
Here's the claim I'll actually defend: the Jellyfish curve flattens because of coordination — and I didn't escape it. I became it.
In a companion Skillenai analysis I've been picking apart how engineering orgs spend their marginal effort, and the pattern is stubborn: coordination is nearly invariant — roughly 7–9 engineers per manager — and most of it gets badged as engineering-management, TPM, and product-owner headcount rather than shown as the overhead it is. The bigger the team, the larger the fraction of every new hour that disappears into standups, handoffs, review queues waiting on a human in another timezone, and the sheer work of keeping N people's mental models in sync. That is the Coordination Tax, and it's exactly the kind of cost that makes an output curve bend over.
Notice the shape of that cost: it's many-to-many. It grows with the number of people who have to stay in sync with each other. A fleet of agents doesn't have it — the agents don't sit in each other's standups or wait on each other's reviews. But someone still has to point them at the work, approve every pull request, and decide what ships next. That someone is me. I approve every PR by hand and assign every ticket myself. I'm not asleep while a swarm runs the company — I am the single coordination layer they all route through.
That's the move, and it's also the catch. I traded distributed, many-to-many coordination for centralized, one-to-many coordination — and one human doing the centralized kind is far cheaper than a dozen humans doing the distributed kind. So I clear the individual-contributor plateau without much trouble. But the tax didn't vanish. Watch where my output actually lands: almost exactly one team's worth — \~6× a single developer. That's not a coincidence. It's my span of control. One person directing a fleet tops out at roughly one team, the same 6–9 span-of-control number that governs every org chart ever drawn. The Coordination Tax didn't disappear when I went solo. It collapsed onto one person — me — and it caps that person at one team.
To go further, I'd need agents that coordinate other agents: a hierarchy, managers of managers. I haven't built that, because I don't yet trust an agent to run its own team of agents. So I'm the bottleneck, deliberately, for now.
And notice what this argument is not. It is not "the model is superhuman." If the plateau were a model-capability ceiling, it would cap me too — and it plainly doesn't. I'm at 23, not 4. What separates me from the million-developer-week average isn't the model. It's that a whole team's coordination now happens inside one head.
The economics are the funny part
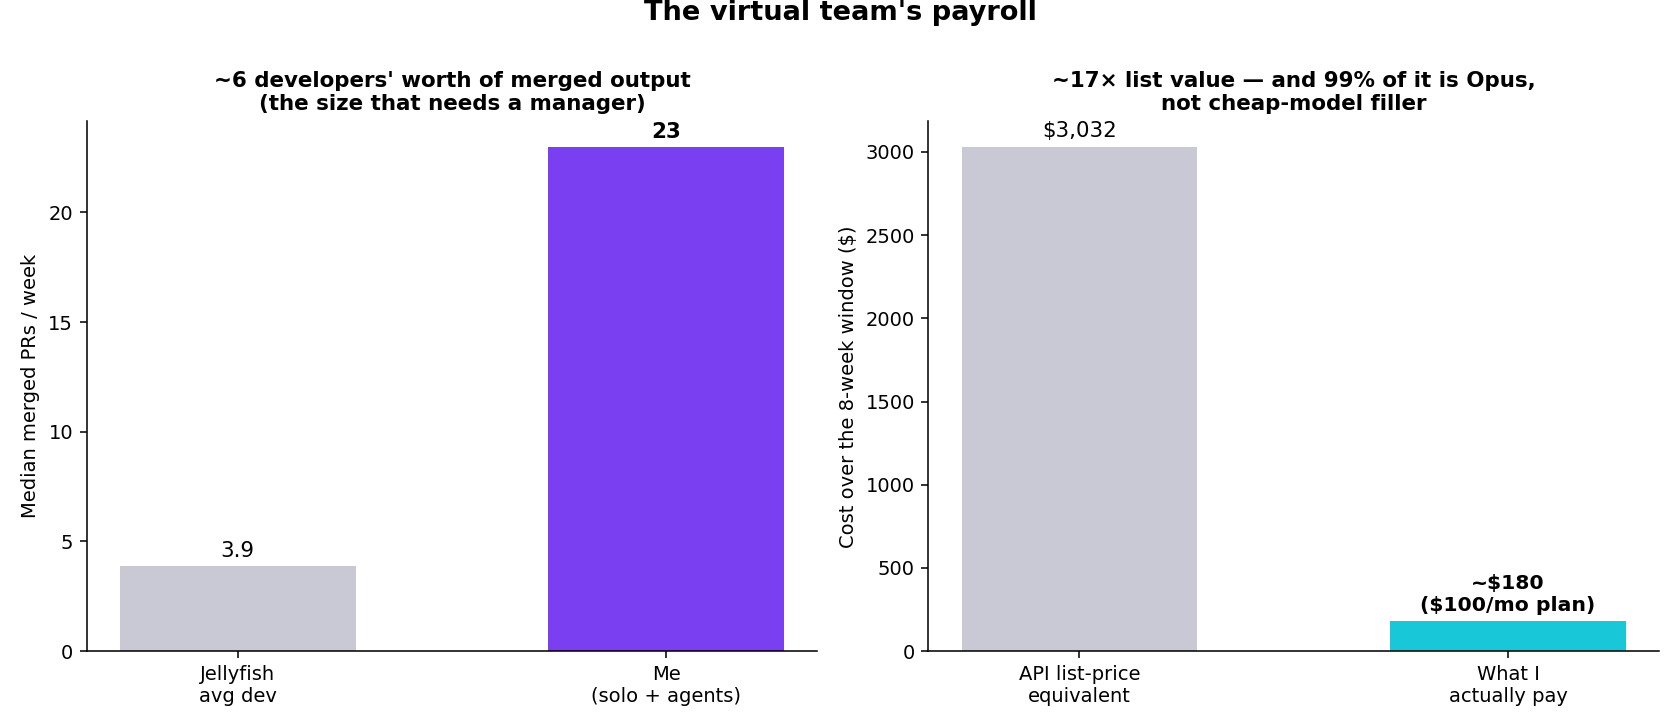
Two numbers make the "virtual team" framing real:
- \~6 developers' worth of merged output. 23 PRs/week ÷ 3.9 (the Jellyfish per-dev ceiling) ≈ 5.9 — precisely the team size at which span-of-control math says you'd hire a manager. I get that team's throughput, and I am the manager: the whole team-plus-manager collapses into one person and a fleet of agents.
- A payroll of about $100/month. Tooling prices my usage at $3,032 for the eight weeks — but that's the API list-price equivalent, not what I pay. I'm on a $100/month Claude subscription. My real out-of-pocket for the window is roughly $180. The subscription delivers around 17× its list value — call it $1,700/month of usage for a $100 bill.
And none of it is cheap-model filler: 98.9% of my tokens and 99.6% of the cost are Opus, almost entirely Opus 4.8. This is premium-model work, not a haiku token count run up to look impressive. (For the curious: 97% of those tokens are cache reads, billed at roughly a tenth of the input rate — and that discount is already in the $3,032. Priced without caching, the list number would be closer to $50K.)
The pricing model is the real unlock
This is, honestly, why I moved from Cursor to Claude Code. Cursor's pricing is usage-based — and it more or less has to be, because it pays third-party model vendors per token. Every token you spend is a token it owes upstream, so it can't just eat your usage behind a flat fee. (Even its push into in-house models is partly an attempt to escape that pass-through.) A subscription that swallows the token cost can really only exist when the vendor also owns the model.
That structure — not any single feature — is what makes keeping the fleet busy a rational default instead of a running budget decision. Metered per-token at these volumes, I'd flinch every time I kicked off a run, and I'd instinctively throttle myself back down into the "interactive coding" band. The flat plan removes the meter, and removing the meter is what lets you sit on the far right of that x-axis at all. The plateau on Jellyfish's chart is largely coordination — but the reason anyone reaches orchestration scale is partly which pricing model they happen to be standing on.
The honest caveats
I'd rather hand you these than have you find them:
- What "tokens" means. About 97% of my volume is cache reads — agents re-reading large contexts. On a billable-non-cache definition, my weekly input+output is only \~0.5–6M, which would drop me to the far left of the chart. I read Jellyfish's axis as total throughput (their 50M starting point is unreachable otherwise), but you should know the metric is load-bearing here.
- PR granularity. A big share of these PRs are authored by agents inside orchestrated flows. They're plausibly finer-grained than a human's hand-written PR, so "23 PRs" is a claim about merged throughput, not 23 acts of individual genius. The tickets number is the more conservative read.
- The tax buys something. Coordination isn't pure waste. It buys shared context, mutual error-catching, and institutional memory. I'm the only human in the loop, which means there's no second pair of human eyes on anything I approve — I'm the reviewer, the assigner, and the only check. That's fine for a side project and emphatically not fine for a bank.
- n = 1. One person, eight weeks, one setup. This is a demonstration, not a study.
What I take from it
The plateau is real — for teams. It's a curve built from developers embedded in orgs, and it measures coordination drag at least as much as it measures the tool. Replace a team's internal coordination with a fleet of agents you direct yourself, and you blow straight through the individual-contributor ceiling.
But you don't escape the Coordination Tax — you inherit it. One person can be the coordination layer for about one team's worth of agents, and then you hit a new ceiling that looks a lot like the old one, one level up. Getting past that means letting agents coordinate other agents, and I'm not ready to trust that yet.
So: the reach of a whole team, on premium models, for the price of a gym membership — run by one person who is now, unavoidably, that team's manager. Look what's possible after hours.
Full methodology, data, and the code that made these charts: github.com/skillenai/skillenai-notebooks. Reference chart: Jellyfish Research, "Two Headwinds of AI Development."