
30 Years of Tech Tools: Novell Is at Zero, SQL Is at an All-Time High
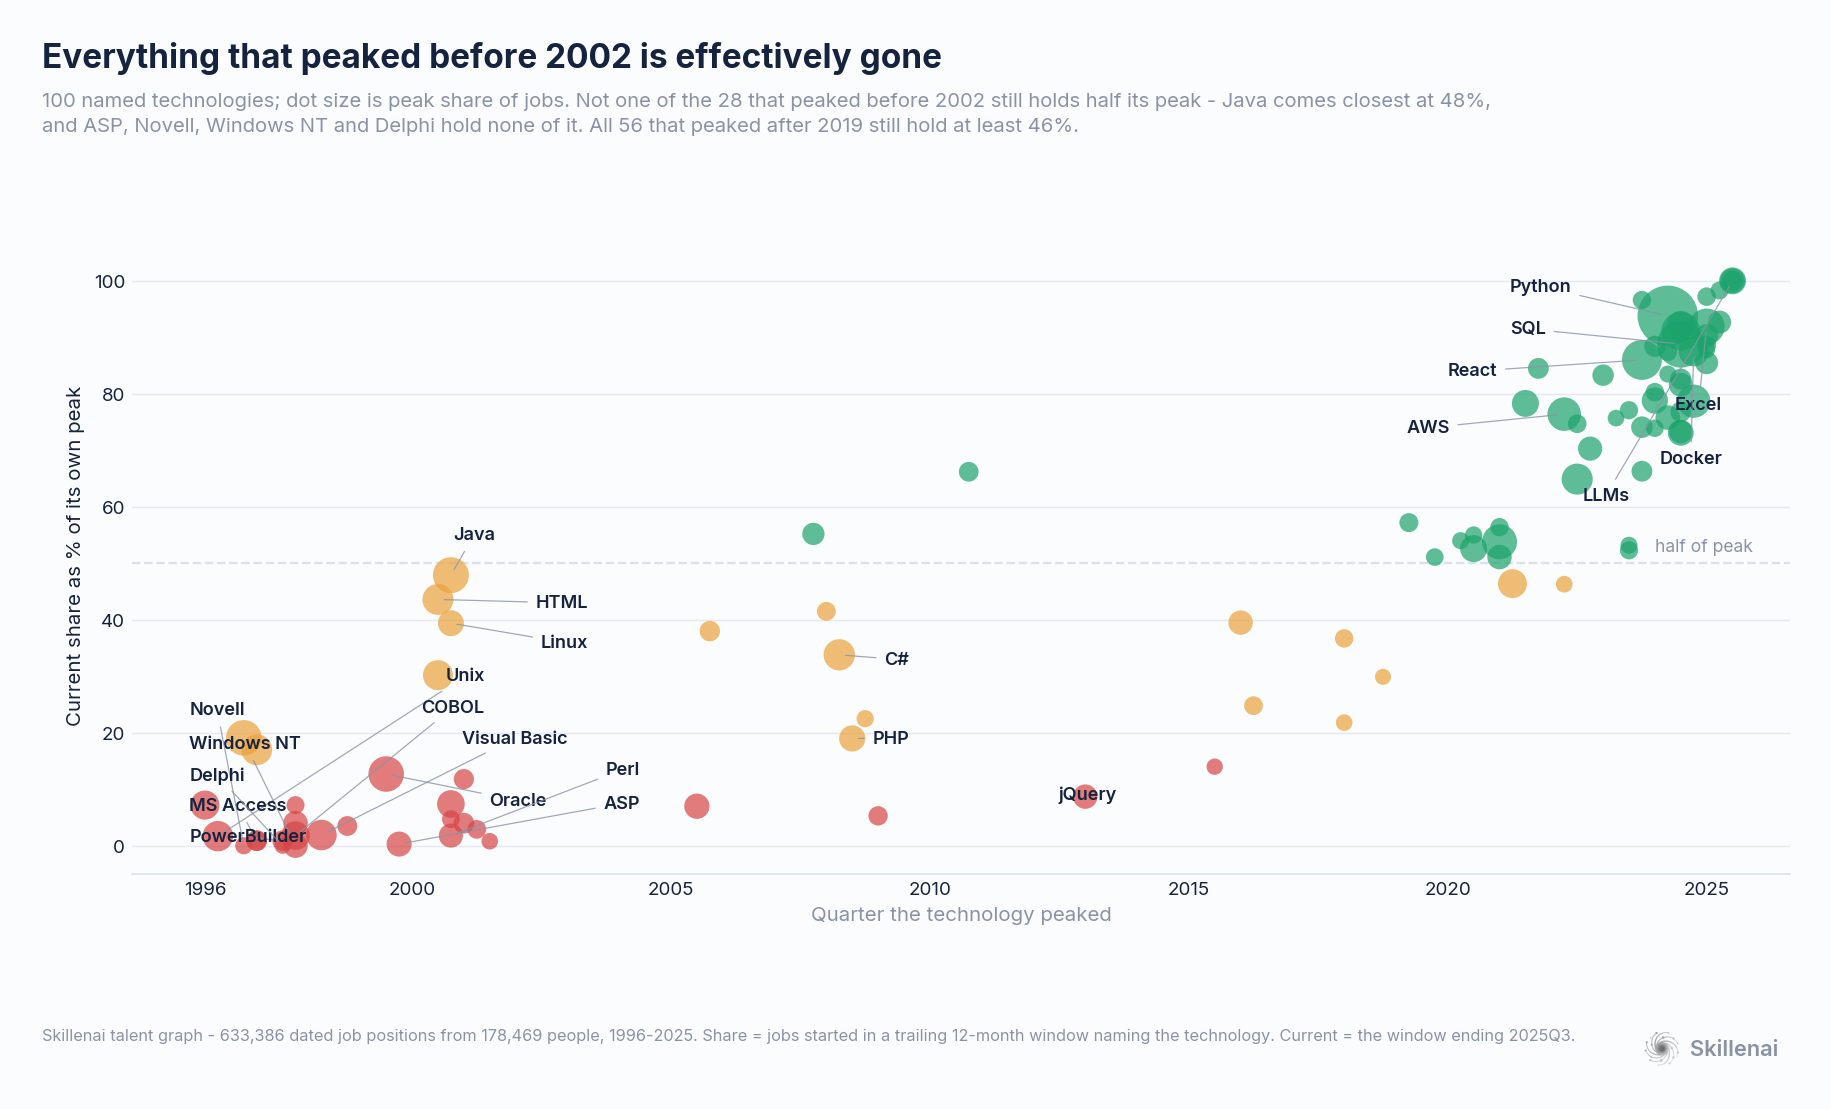
Not one of the 28 named technologies that peaked before 2002 still holds half of its peak. Java comes closest, at 48%. ASP, Novell, Windows NT and Delphi hold none of it — they round to zero.
Then the churn stopped, and it has been quiet for about seventeen years. Here is what thirty years of tech tools actually looks like, traced through 633,386 dated job positions held by 178,469 people.
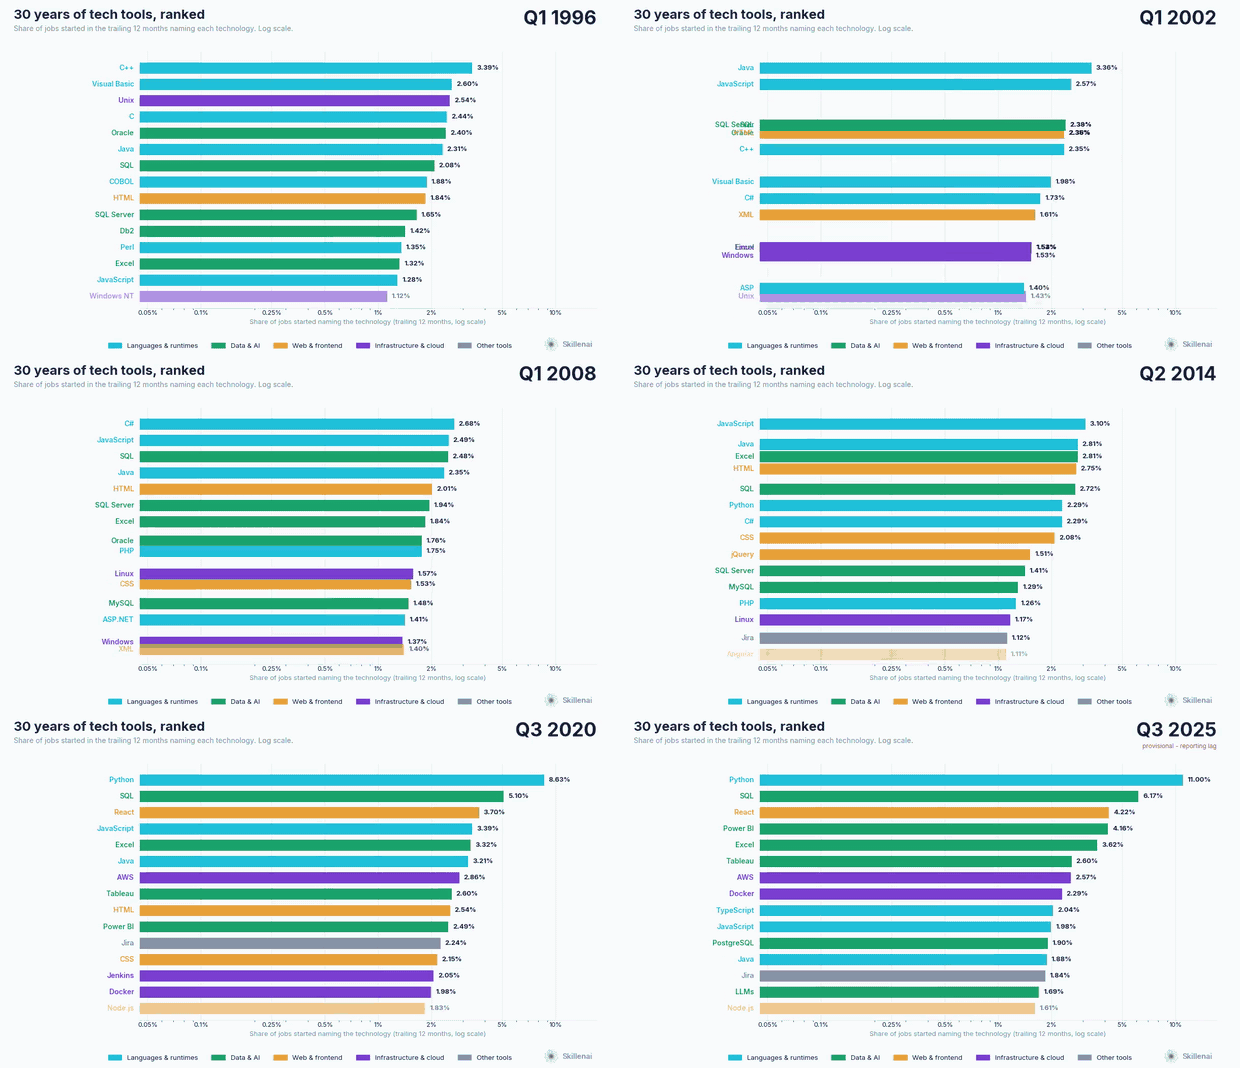
Each bar is the share of jobs started in the trailing twelve months whose description names that technology. The 1997 board is C++, Java, Windows, Unix, Oracle, Visual Basic, COBOL, SQL, C, HTML. The 2025 board is Python, SQL, React, Power BI, Excel, Tableau, AWS, Docker.
Two names survive the trip.
Get an email when we publish a new post. No account needed, unsubscribe anytime.
The cliff at 2002
| peaked 1996–1998 | now vs peak | peaked 1999–2001 | now vs peak |
|---|---|---|---|
| Novell, Windows NT, Delphi | 0% | ASP | 0% |
| MS Access, PowerBuilder, Solaris | 1% | Flash | 1% |
| COBOL, Unix, Visual Basic | 2% | Perl | 2% |
| Db2, Crystal Reports | 4% | JSP | 4% |
| C | 7% | XML | 7% |
| Oracle | 13% | Linux | 39% |
| C++ | 19% | HTML, Java | 44%, 48% |
There are two populations here with almost nothing between them. Everything on the left is at or near zero. Every one of the 56 technologies that peaked after 2019 still holds at least 46% of its high.
Java and Perl peaked in the same quarter — 2000Q4 — after identical 19-quarter climbs. Java kept 48% of its peak. Perl kept 1.8%. A 27x difference in what survived, from the same starting line. Whatever separates a tool that lasts from one that doesn't, it isn't when it showed up.
The churn stopped
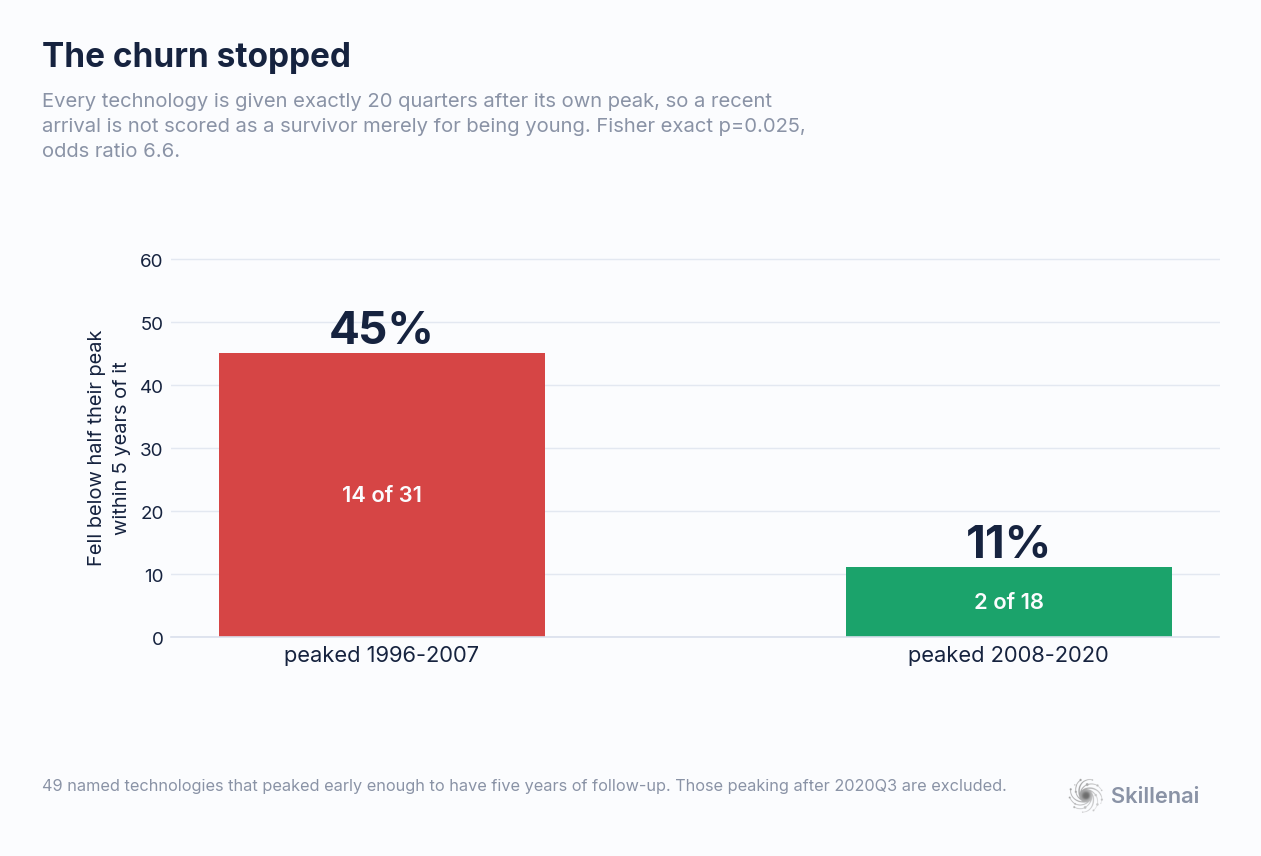
The obvious objection is that recent tools simply haven't had time to die. So every technology gets exactly 20 quarters after its own peak — the same follow-up for all of them, with anything peaking after 2020 excluded for not having five years yet.
The gap survives. 45% of 1996–2007 peakers fell below half their peak within five years. For 2008–2020 peakers it's 11% (Fisher exact p=0.025, odds ratio 6.6).
The modern stack has been unusually stable. Python, SQL, AWS, Docker, React and Postgres have mostly been climbing for seven to ten years without a serious challenger appearing.
Except for one thing
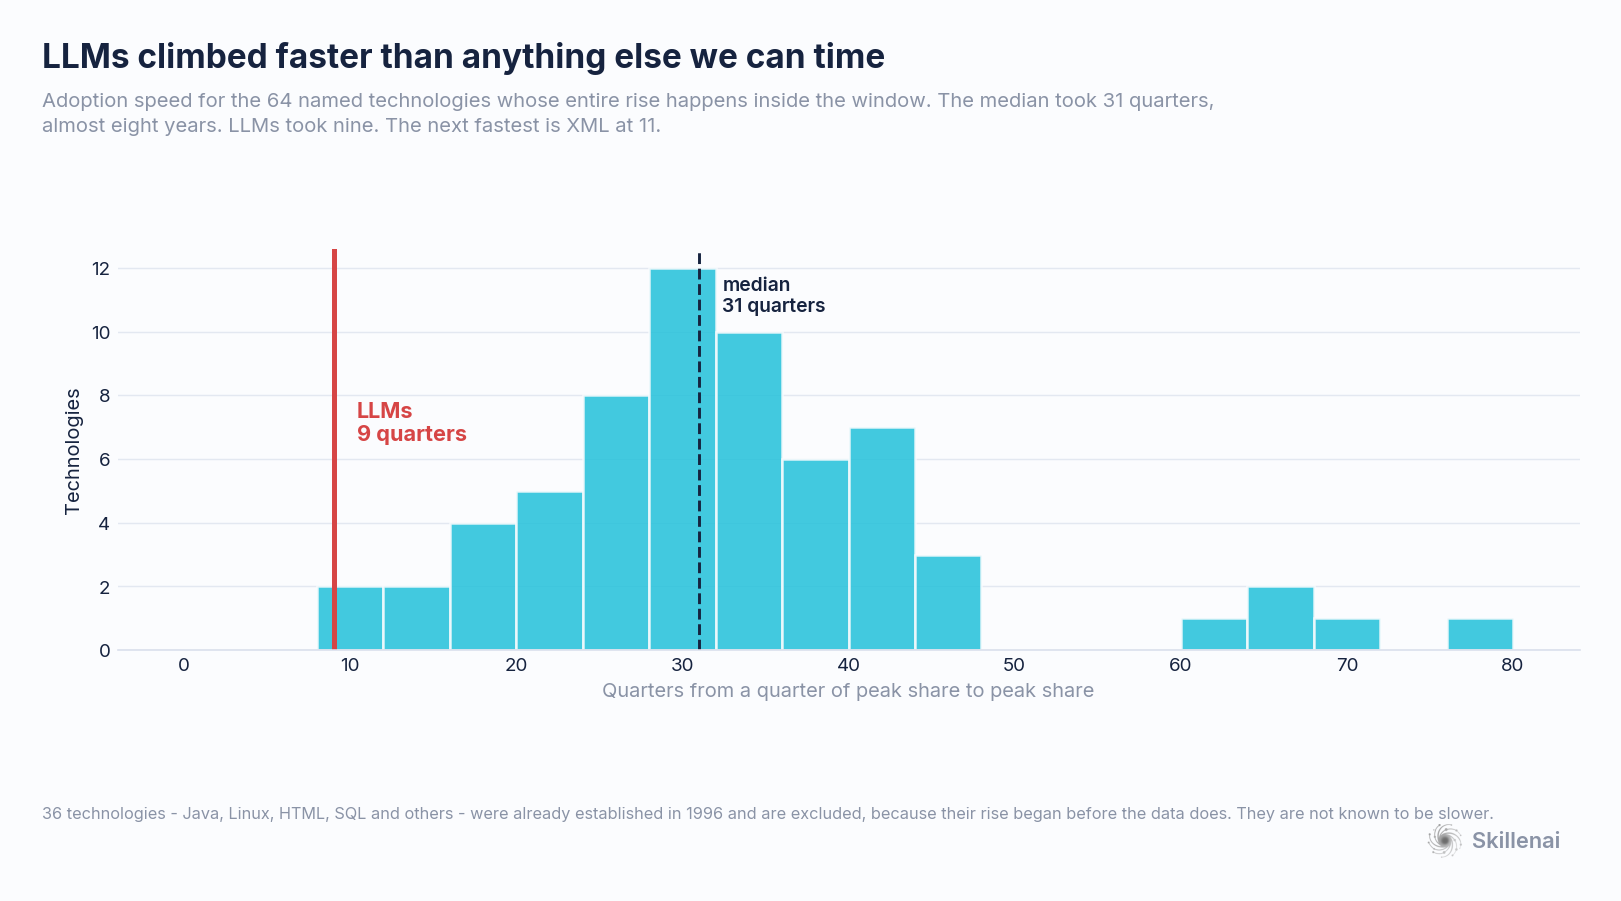
LLMs went from a quarter of their peak to their peak in 9 quarters. The median named technology took 31 — close to eight years. The next fastest is XML, at 11.
That's a bounded claim and worth stating as one: 36 technologies, Java and Linux and SQL among them, were already established when the data starts in 1996, so their rise can't be timed and they're excluded. Among the 64 whose whole climb is visible, LLMs is the fastest.
So the AI stack isn't adding to an already-churning market. It's landing on one that had gone quiet — which is a different situation, and arguably a more disruptive one.
The oldest tools are at their all-time highs
| technology | first shipped | quarters rising | peaked | share at peak |
|---|---|---|---|---|
| Excel | 1985 | 116 | 2025 Q1 | 3.94% |
| SQL | 1974 | 114 | 2024 Q3 | 6.95% |
| Python | 1991 | 34 | 2024 Q2 | 11.72% |
Python's 11.72% is the highest share any technology reaches anywhere in these thirty years. For scale: the most common technology of 1998 was Oracle at 3.44%, and nothing that peaked before 2015 ever got above 4%.
Tools are not the fragile part
The standard advice is to invest in durable capabilities rather than specific products, because products churn and capabilities don't. On this data that's backwards.
| terms ever reaching | named technologies | all other skill terms |
|---|---|---|
| 0.5% of a year | 0.77 | 0.54 |
| 0.1% of a year | 0.67 | 0.33 |
| 0.02% of a year | 0.67 | 0.00 |
Median current share as a fraction of the term's own peak.
Named technologies are more persistent than the average skill phrase, at every frequency cut. The advice isn't wrong about Novell — it's wrong about the base rate. Products that reach real adoption tend to stay. It's the vague middle of the vocabulary that evaporates.
What predicts whether a tool survives is when it peaked, not whether it's a product.
I'll flag that this reverses an earlier version of this analysis, and the reason is worth knowing. That version drew its skill vocabulary from present-day job postings and matched it backwards against old résumés. Every term in a present-day dictionary still exists today by construction — so the "generic skills" comparison set couldn't contain a word that had fallen out of use, while named tools could still show decline. That asymmetry produced the result. It also meant the tools that vanished outright were invisible: Novell, Windows NT, Delphi, ASP and PowerBuilder are the entire left edge of the chart above, and the old instrument couldn't see any of them.
An instrument anchored in the present cannot measure disappearance. Point one at the past and it will reliably tell you less changed than did.
What this means for your career
- Auditing your résumé by "is this a product or a skill" won't help. The split that matters is generational, not categorical.
- If you learned the current stack, you've had an unusually easy decade. Someone who picked up Python, SQL and Linux in 2015 has had to replace almost nothing. Someone who picked up Visual Basic and Novell in 1997 lost essentially all of it inside five years.
- Seventeen quiet years is an observation, not a law. The one technology currently moving at 1990s speed is the newest one on the board.
Methodology
Skills are extracted per position by a language model from that position's own description, resolved to entities, and attached to the position's start date, employer and title. Share means positions started in a trailing twelve-month window naming a technology, over positions started in that window naming any skill.
Twelve-month windows matter for two reasons: a source date carrying only a year is imputed to January, which puts 17.7% of all starts there at 2.4x the expected rate, and a twelve-month window contains exactly one January so it cancels. The window also removes calendar seasonality, so a partial final year doesn't read as a collapse. Employment records run to roughly October 2025; later windows are drawn and labelled provisional, and nothing here rests on them.
Three artifact checks ran before any of this was interpreted. Early years are thin — 3,227 skill-bearing positions in 1996 against 44,267 in 2022 — and noise both depresses year-to-year similarity and inflates apparent diversity, so churn is measured against a split-half null at a sample size held equal across all years. Under that null, year-over-year skill churn shows no trend at all across thirty years. Skills per position drifts from 4.5 to 6.7, so concentration was recomputed within strata of identical skill count. And the pattern replicates on a fixed set of 84 well-canonicalised technologies, so it isn't older text being described in vaguer language.
A fourth check was run because the extraction pipeline is known to under-yield on profiles with 11 or more positions — the long careers that carry the 1990s data, so the bias points straight at this. It's real: that band returns 2.93 skills per position in 1996 against 4.74 for the 4-6 band. But it's only 1.3-2.6% of positions in any year, its share drifts slightly down rather than up, and removing it entirely moves nothing — Visual Basic 1.4% to 1.5% of peak, COBOL 2.3% to 2.4%, Java 64.3% to 64.9%.
Survivorship is the main limitation: a 1996 position exists in this data only if the person holding it still kept a profile in 2026, which biases early years toward people whose careers lasted — and therefore, if anything, understates how completely the 1990s stack died.