The most authoritative data-viz writing on the web (and the people behind it)
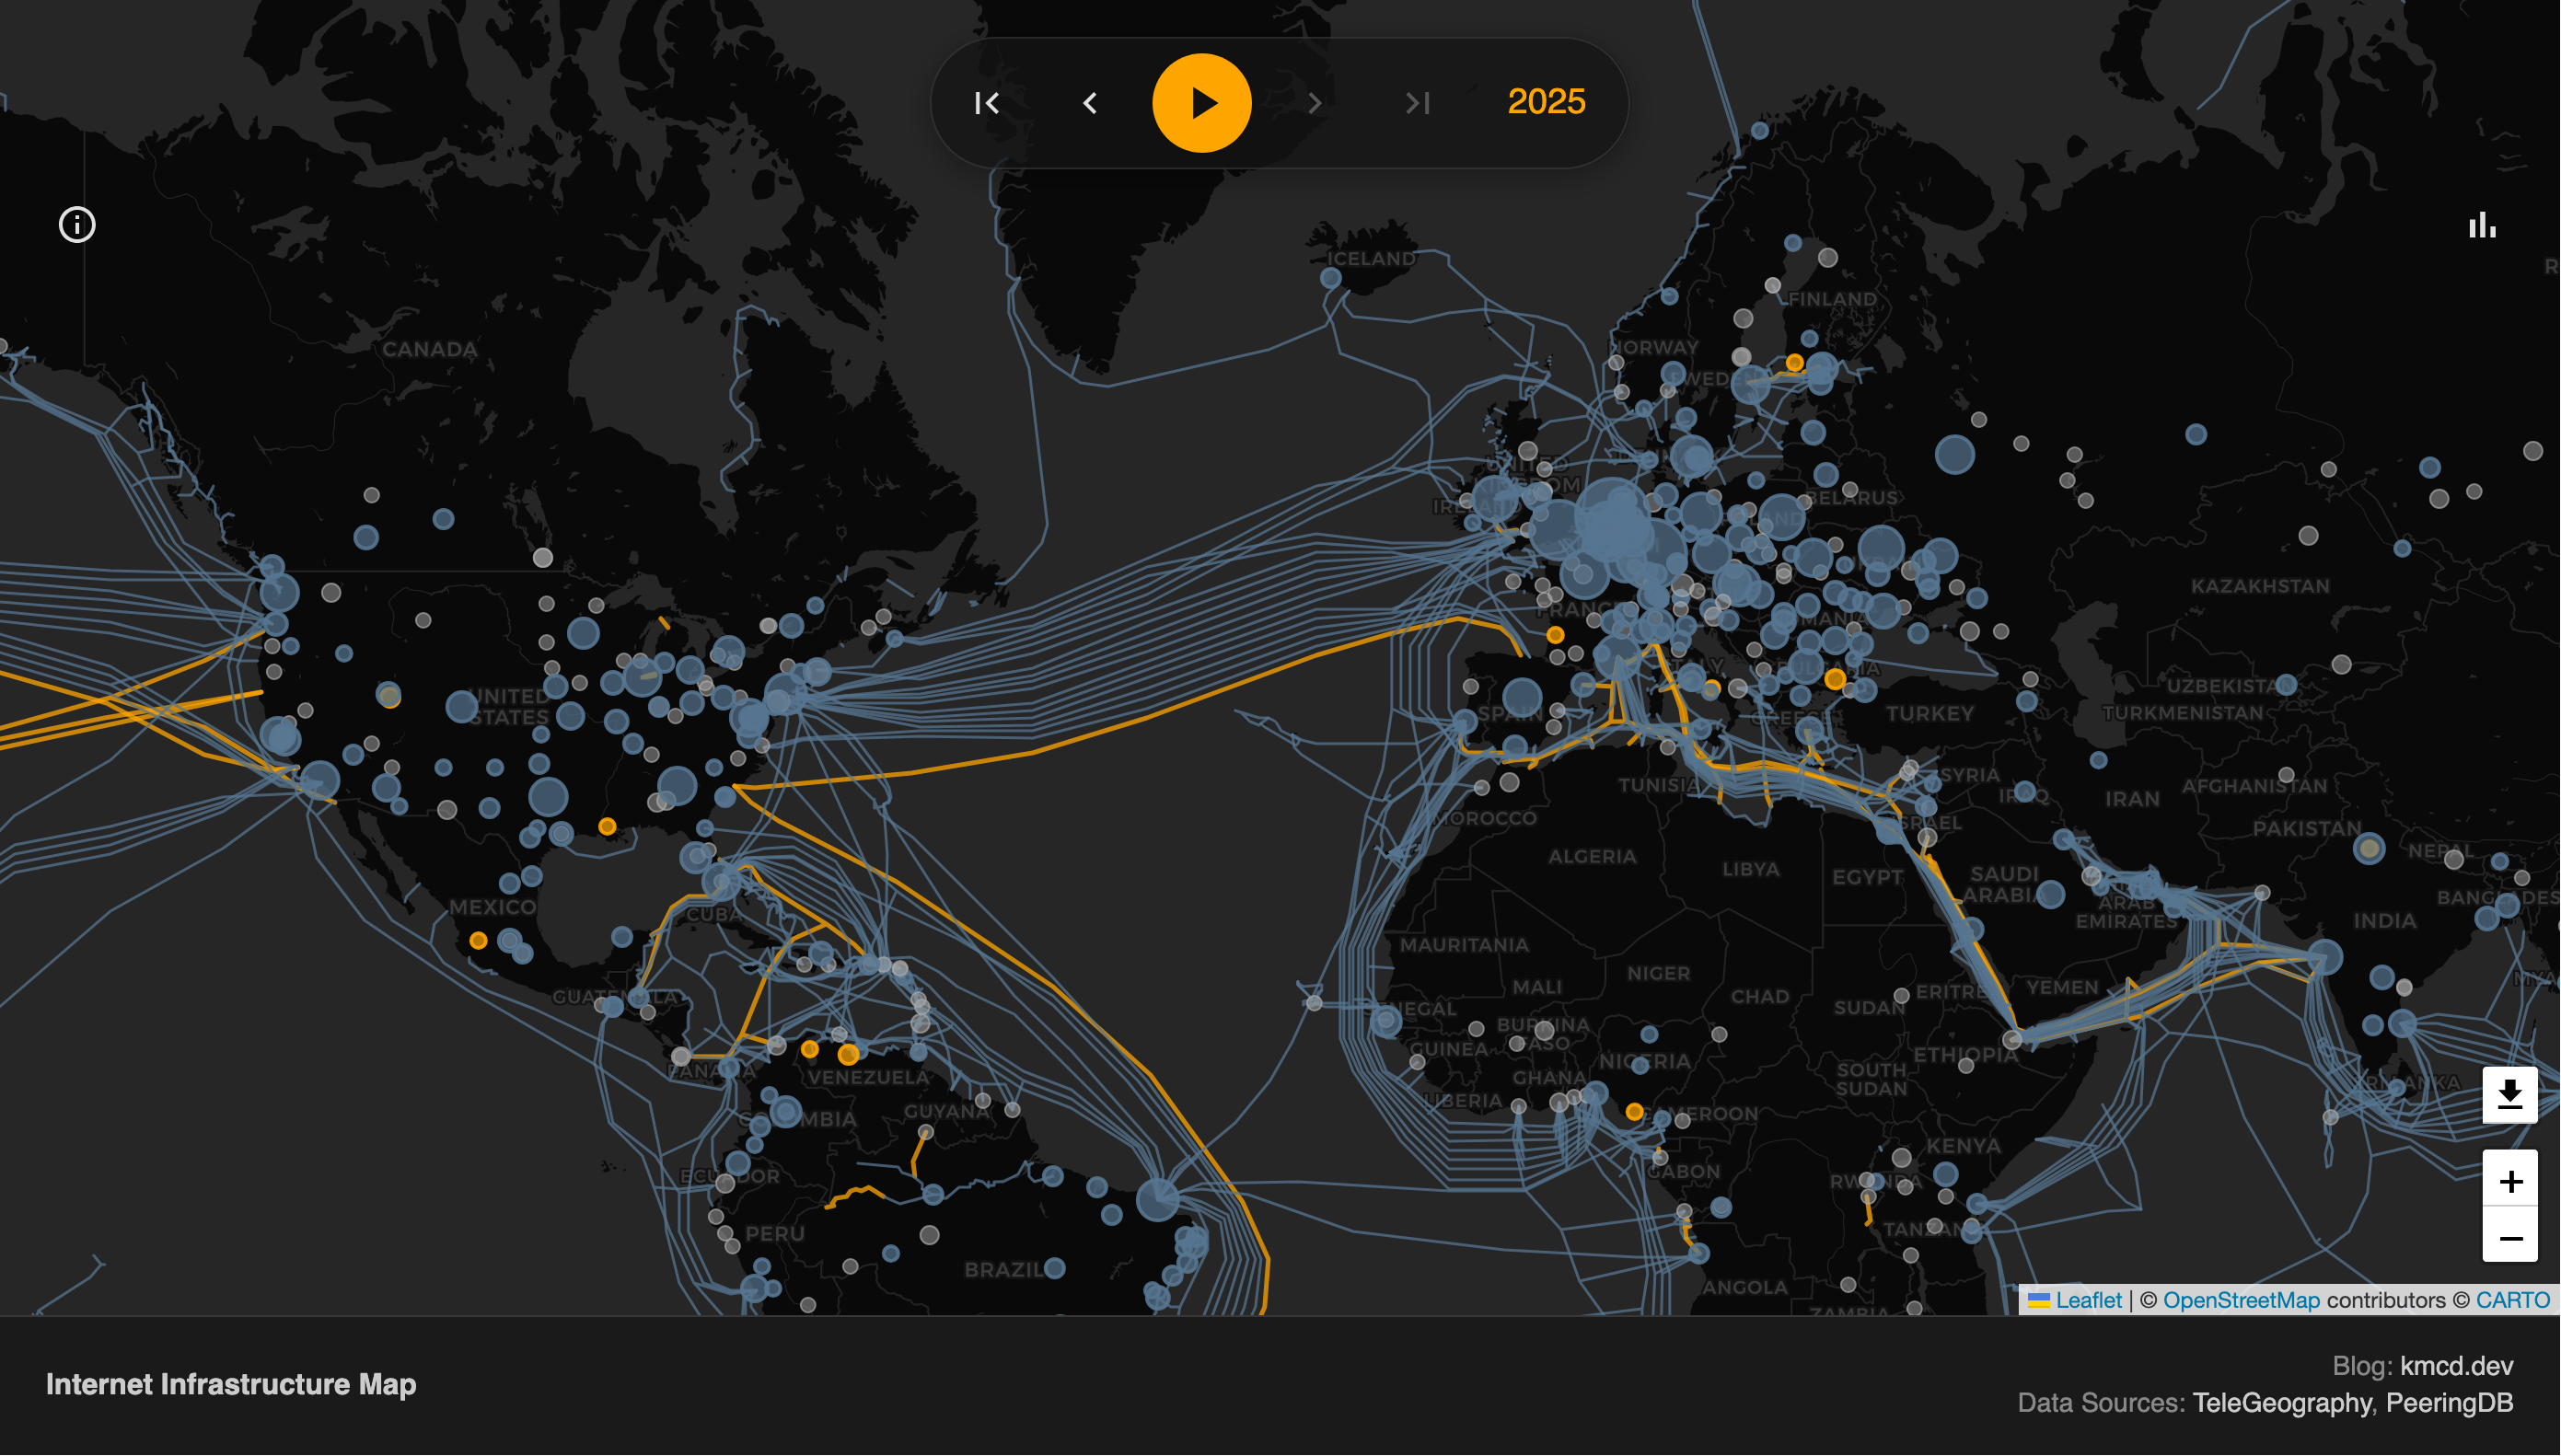
Five visualizations worth showing your team this month: the WHO global-health dashboard, Andrew Heiss's animated dplyr verbs, kmcd.dev's annual Internet treemap, MotherDuck's embeddings explorer, and Enrico Bertini on using dataviz to understand how LLMs "think". Plus the people behind the work and the writing worth catching up on.