
The AI Paper Flood Is 28x More Researchers, Not 28x More Slop
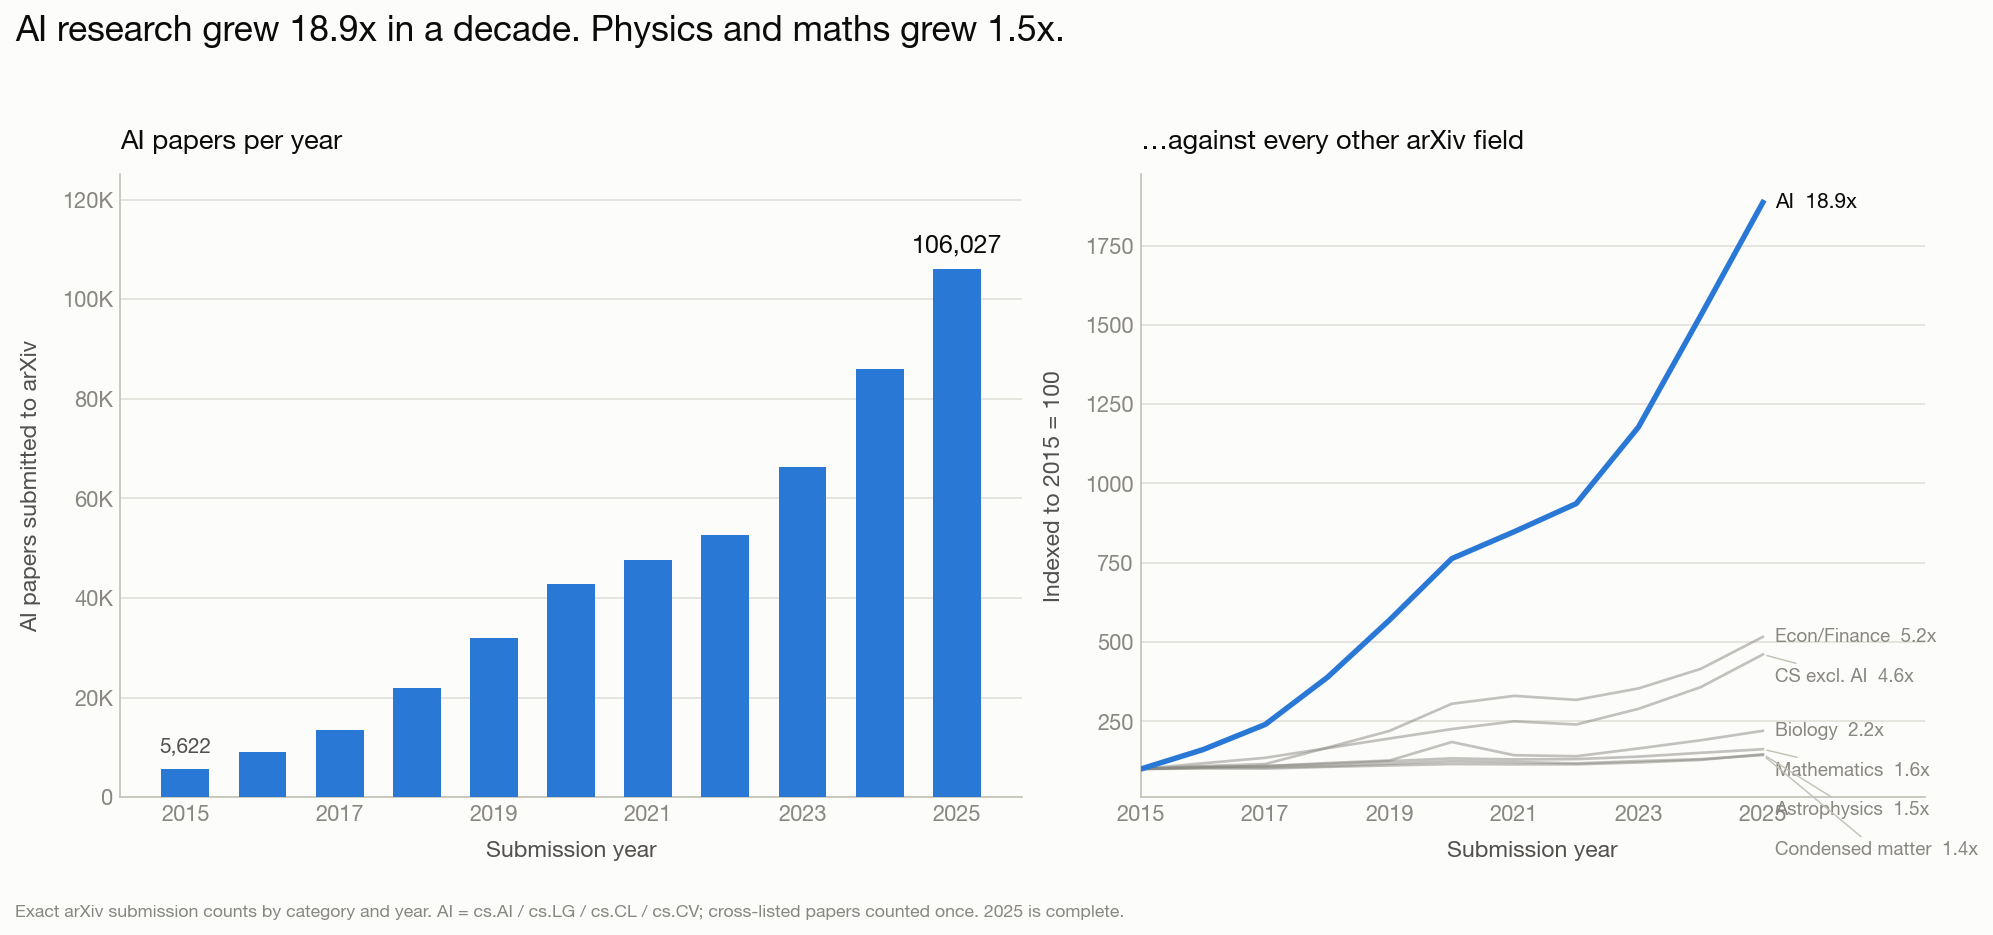
Everyone agrees the AI research flood is real. arXiv took in 106,027 AI papers in 2025, up from 5,622 in 2015 — a 18.9x increase in a decade.
The consensus explanation is machine-generated slop: large language models made papers cheap to produce, so the field is drowning in them.
We tested that. The volume is real. The explanation is wrong.
Get an email when we publish a new post. No account needed, unsubscribe anytime.
AI didn't ride a rising tide
The simplest objection is that arXiv as a whole got busier. It didn't.
| Field | 2015 | 2025 | Growth |
|---|---|---|---|
| AI (cs.AI/LG/CL/CV) | 5,622 | 106,027 | 18.9x |
| Econ / Finance | 875 | 4,519 | 5.2x |
| Computer science excluding AI | 2,225 | 10,258 | 4.6x |
| Biology | 2,300 | 5,068 | 2.2x |
| Mathematics | 32,291 | 52,419 | 1.6x |
| Astrophysics | 14,938 | 21,870 | 1.5x |
| Condensed matter | 16,763 | 24,115 | 1.4x |
Mature fields grew 1.4–1.6x over the same decade, on the same platform, under the same publish-or-perish pressure. AI grew roughly thirteen times faster than they did — and four times faster than the rest of computer science.
So the flood is real and it is specific to AI. The question is what it's made of.
It's people, not productivity
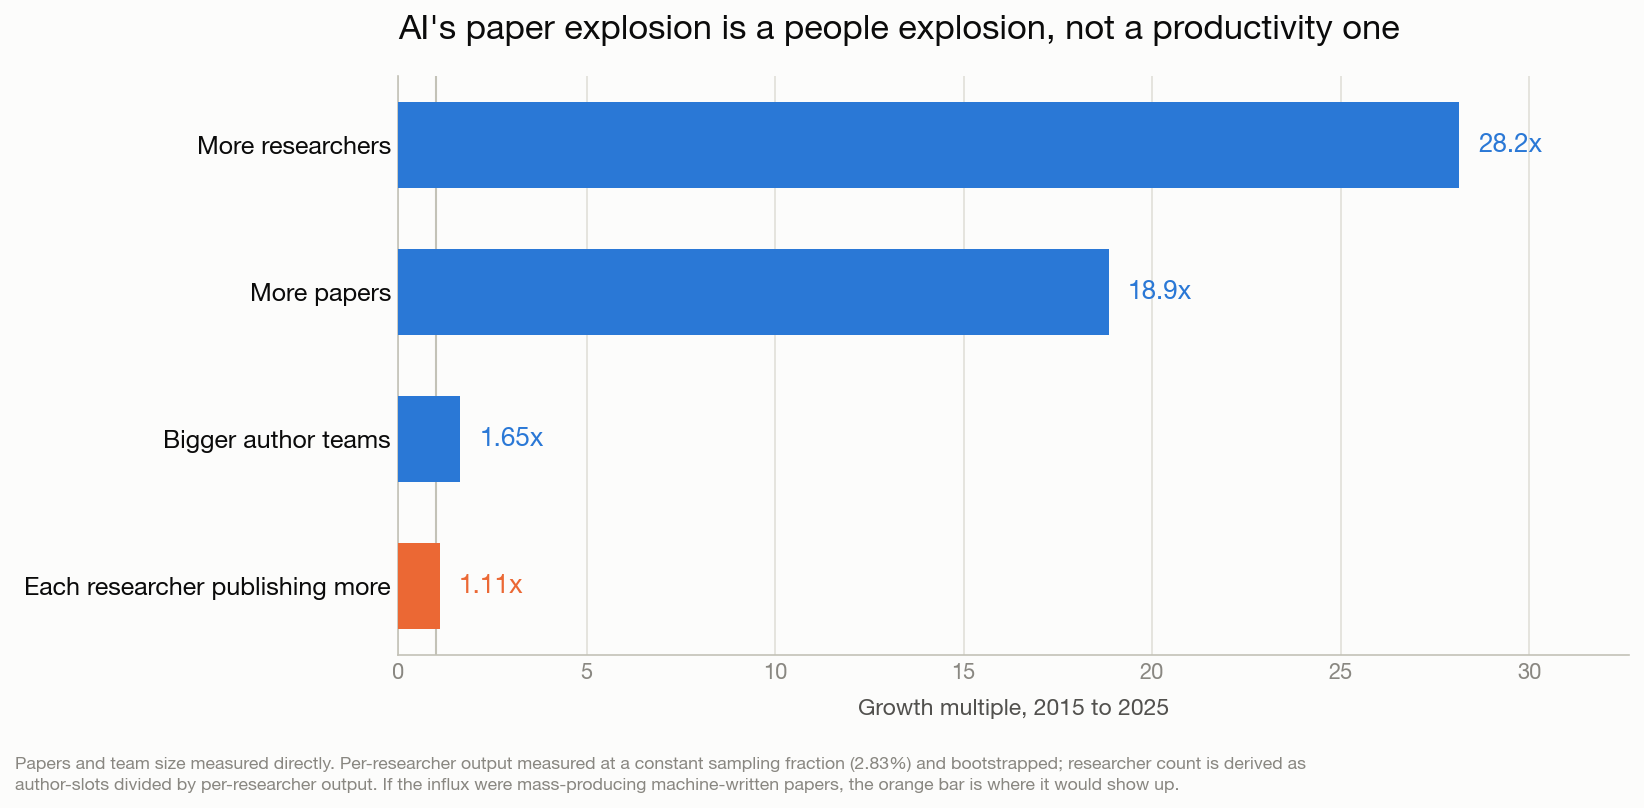
Paper output decomposes cleanly. Papers equal researchers, times papers per researcher, divided by authors per paper. Run the numbers and the answer is unambiguous.
| Component | 2015 to 2025 |
|---|---|
| More researchers | ~28x |
| More papers | 18.9x |
| Bigger author teams | 1.65x |
| Each researcher publishing more | 1.11x |
Headcount explains roughly 97% of the growth. Per-researcher output explains about 3%.
Measured carefully across the decade, output per researcher rose 8.8%. That trend is real and remarkably steady — a linear fit gives an R-squared of 0.95 — but look at the magnitude. A 9% lift per person, against a 28-fold increase in people.
If LLMs had turned researchers into paper machines, this is exactly where it would show up. It doesn't.
Astronomy is the control group
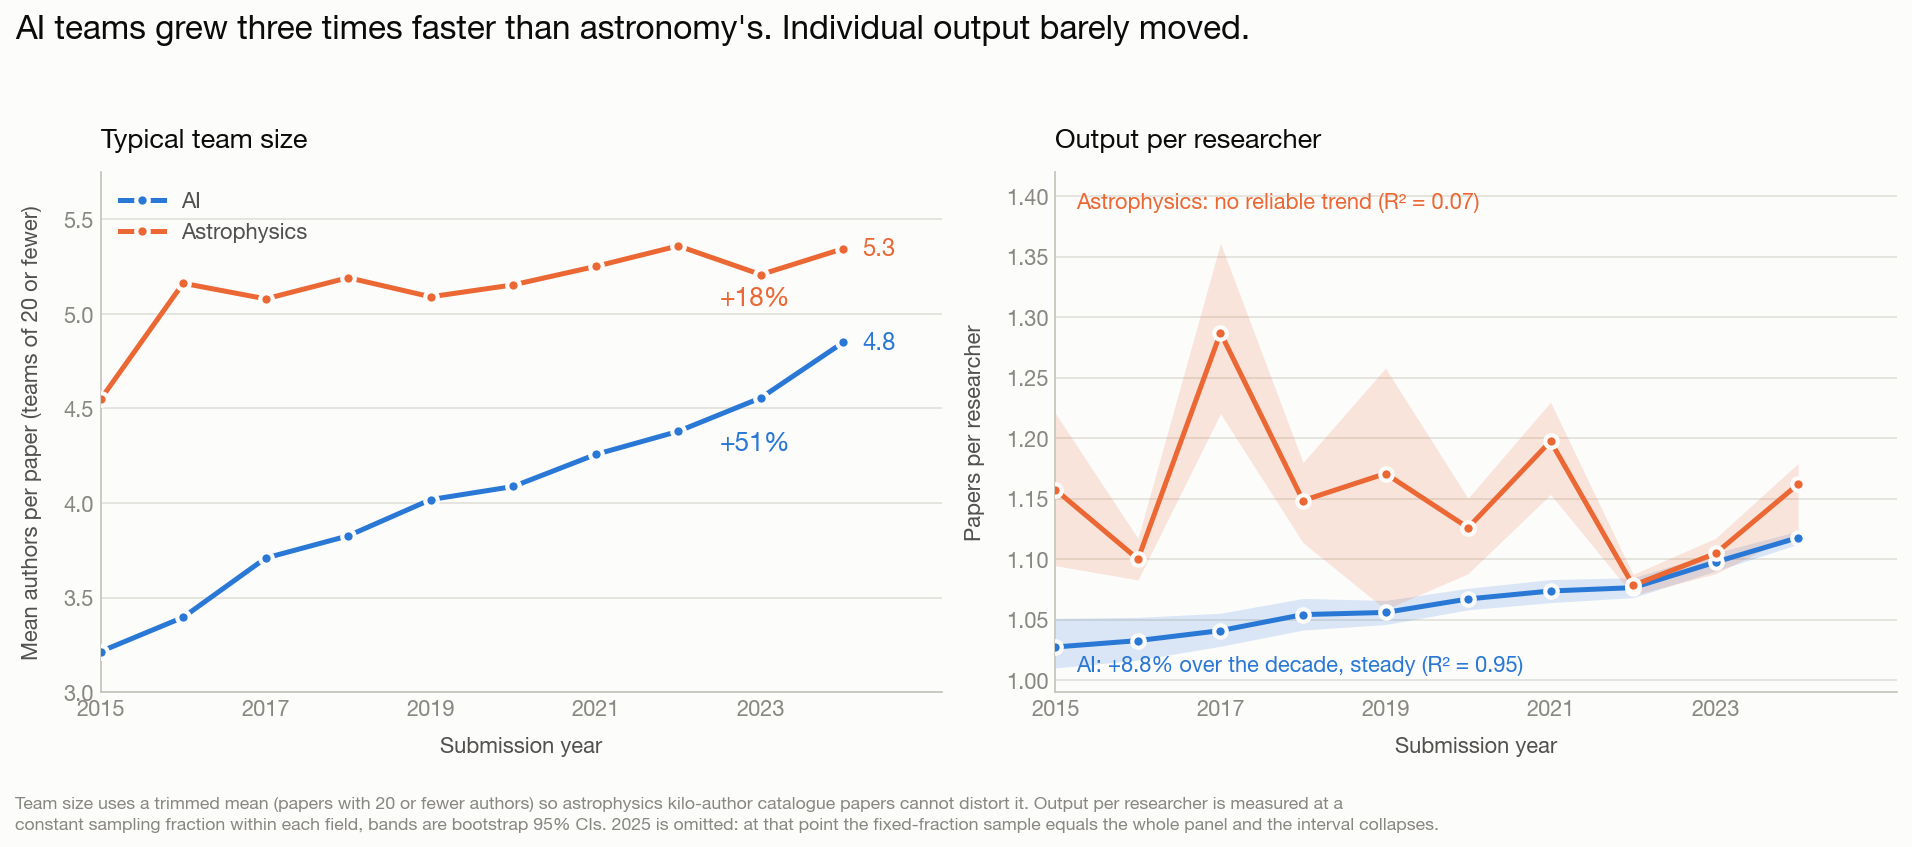
Astrophysics is a useful counterfactual: a mature field on the same platform, with the same career incentives and the same access to the same writing tools, but no comparable influx of new people.
| Papers | Team size | Output per researcher | |
|---|---|---|---|
| AI | 18.9x | 3.21 to 4.85 (+51%) | +8.8% (steady) |
| Astrophysics | 1.5x | 4.55 to 5.34 (+18%) | no reliable trend |
Two things stand out.
Team inflation is AI-specific. The typical AI paper went from three authors to nearly five — a 51% increase, against 18% in astronomy. That's what you'd expect from a field absorbing a large cohort of newer contributors who join existing teams rather than leading their own.
Neither field shows a productivity revolution. AI's +8.8% is genuine but small. Astronomy's series has no reliable direction at all. Whatever AI writing tools are doing to scholarly output, it is not a step change in papers per person — in either field.
The papers are not copies
Here is the claim that's easiest to state and hardest to test: that arXiv is filling up with the same paper written over and over.
Every paper in our scholarly index carries a 256-dimension abstract embedding, which makes an exact all-pairs comparison tractable. We ran it across 84,420 papers, after removing duplicate records — an essential step, since double-ingested papers would manufacture the very duplicates we were measuring.
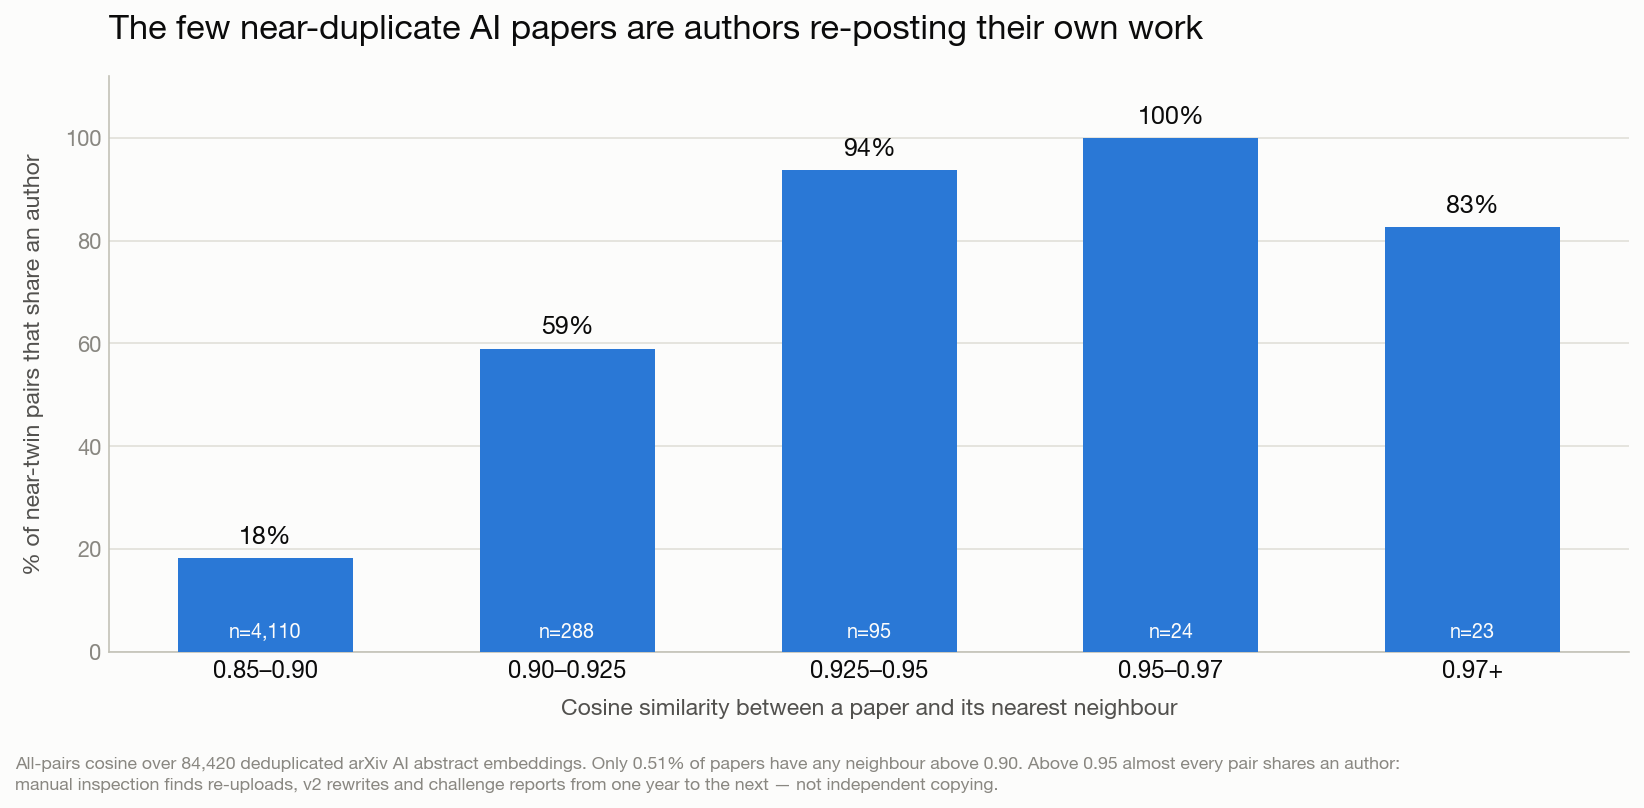
Only 0.51% of papers have a near-twin. At a tighter threshold it's 0.06%. At the tightest, four papers in the entire corpus.
And the duplicates that do exist are almost entirely self-authored.
| Similarity band | Pairs | Share an author |
|---|---|---|
| 0.850–0.900 | 4,110 | 18.3% |
| 0.900–0.925 | 288 | 59.0% |
| 0.925–0.950 | 95 | 93.7% |
| 0.950–0.970 | 24 | 100% |
We calibrated those thresholds by reading pairs at each level rather than assuming a cutoff. Above 0.95, the matches are re-uploads under a new identifier, versioned rewrites — one speech-codec paper appears at "200bps" and again at "300bps" with the same seven authors — and annual challenge reports. Researchers re-posting their own work, not a duplication machine.
This measures redundancy, not quality. A field could produce a hundred thousand entirely distinct and entirely forgettable papers and score exactly the same. What we can rule out is mass duplication. The critique that a lot of the work is marginal is untouched by this result, and nothing here refutes it.
What we could not measure, and why it matters
Two negative results are worth more than a confident guess.
We cannot detect machine-written text. Embedding similarity measures redundancy, not authorship. The published literature can measure this and does: analyses of over a million preprints estimate that up to 22% of computer science papers contain LLM-modified text. Machine-assisted writing is genuinely present. Our finding is narrower — it isn't what's driving the volume, because volume tracks headcount and per-person output barely moved.
We cannot measure peer-review rates from arXiv metadata. We tried, and the attempt failed in an instructive way. Astrophysics publishes in journals, which register DOIs; AI publishes at conferences, which often register neither. Only 18.3% of AI papers carry a structured publication record, against 77.3% in astrophysics. Worse, that share has been falling — down 33 points in astrophysics and 9 points in AI since 2015. Any apparent decline in "peer-reviewed share" is largely a decline in metadata registration.
So we cut every peer-review claim from this analysis. If you see a chart showing AI's peer-review rate collapsing, check whether it's measuring review or bookkeeping.
And you can't name the prolific authors either
The obvious way to find hyper-prolific researchers is to count papers per author name. Do that and the top of the list looks alarming: one name with 269 papers in six months, another with 205.
They aren't people. "Yang Liu" is one of the most common name combinations on earth, and the entire top-40 consists of short, high-frequency names — exactly what collision rates predict.
Splitting each name by shared collaborators resolves "Yang Liu" into 157 distinct research groups. After disambiguation, the most prolific actual individuals publish 30 to 55 papers in six months — remarkable, entirely plausible for a senior investigator running a large lab, and an order of magnitude below the raw count.
There's no affiliation data to do this properly. The arXiv affiliation field is populated on 0.4% of author slots.
What this means
If you're a researcher entering the field: you are one of roughly 28 times more people than a decade ago, and that — not a productivity tool — is what changed. The competition is for attention, not for output.
If you're reviewing: the load grew with the population, not with per-person output. The people writing the papers are not writing more of them each.
If you're hiring: author counts on a CV mean less than they did in 2015, because typical team size rose 51%. A five-author paper today is what a three-author paper was.
If you're arguing about AI slop: the volume is not the evidence. Volume is a headcount story. Whatever is true about machine-written text — and the literature says it's present in up to a fifth of CS preprints — it isn't what made the pile bigger.
This is the third time our analysis has landed here. When entry-level hiring collapsed, the cause turned out to be a frozen labor market rather than AI. When middle management thinned, it was title inflation unwinding. The pattern repeats: a real phenomenon, a plausible AI explanation, and data that points somewhere less dramatic.
Methodology
Exact annual submission counts come from the arXiv API. Cohort samples for team size and output are month-stratified — 3,000 papers per year for AI, 800 for astrophysics. The duplication analysis uses exact all-pairs cosine similarity over 84,420 deduplicated abstract embeddings from the Skillenai scholarly index.
Output per researcher is measured at a constant sampling fraction within each field and bootstrapped. This matters: papers-per-author inside a sample depends on the sampling fraction, not the sample size. An earlier version of this analysis held the sample size constant instead, which let the fraction fall from 53% to 2.8% as the corpus grew and manufactured a fake decline. The corrected design reverses the sign of the result.
Team size uses a trimmed mean over papers with 20 or fewer authors, so astrophysics kilo-author collaborations can't distort the comparison. The 2025 cohort is excluded from trend fits because its constant-fraction sample equals the whole panel.